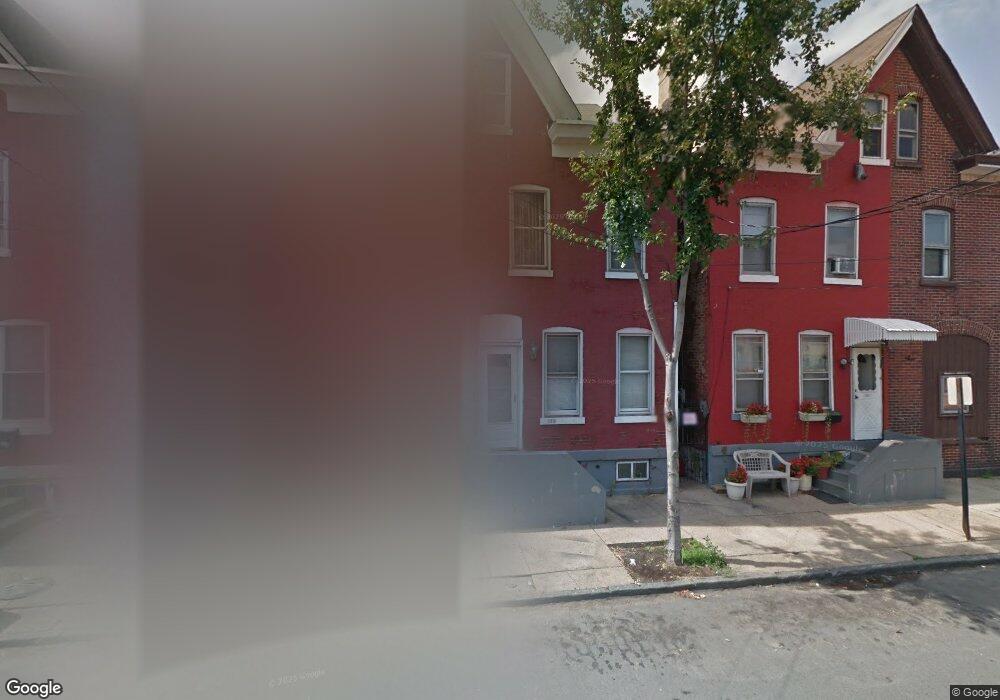
305 3rd St Trenton, NJ 08611
South Trenton NeighborhoodEstimated Value: $179,000 - $211,000
3
Beds
1
Bath
1,552
Sq Ft
$125/Sq Ft
Est. Value
About This Home
This home is located at 305 3rd St, Trenton, NJ 08611 and is currently estimated at $194,324, approximately $125 per square foot. 305 3rd St is a home located in Mercer County with nearby schools including Mott Elementary School, Parker Elementary School, and Grace A Dunn Middle School.
Ownership History
Date
Name
Owned For
Owner Type
Purchase Details
Closed on
Aug 14, 2024
Sold by
Brodt and Brodt Miriam
Bought by
Numbee Realty Llc
Current Estimated Value
Home Financials for this Owner
Home Financials are based on the most recent Mortgage that was taken out on this home.
Original Mortgage
$171,000
Outstanding Balance
$168,166
Interest Rate
6.95%
Mortgage Type
New Conventional
Estimated Equity
$26,158
Purchase Details
Closed on
Sep 6, 2018
Sold by
Harrigan Eric and State Of New Jersey
Bought by
Brodt Nechemia and Brodt Miriam
Purchase Details
Closed on
Mar 10, 2000
Sold by
Chady John
Bought by
Harrigan Eric
Create a Home Valuation Report for This Property
The Home Valuation Report is an in-depth analysis detailing your home's value as well as a comparison with similar homes in the area
Home Values in the Area
Average Home Value in this Area
Purchase History
| Date | Buyer | Sale Price | Title Company |
|---|---|---|---|
| Numbee Realty Llc | -- | Land Track Title | |
| Brodt Nechemia | $33,000 | Goldcrest Abstract Llc | |
| Harrigan Eric | $45,400 | -- |
Source: Public Records
Mortgage History
| Date | Status | Borrower | Loan Amount |
|---|---|---|---|
| Open | Numbee Realty Llc | $171,000 |
Source: Public Records
Tax History
| Year | Tax Paid | Tax Assessment Tax Assessment Total Assessment is a certain percentage of the fair market value that is determined by local assessors to be the total taxable value of land and additions on the property. | Land | Improvement |
|---|---|---|---|---|
| 2025 | $3,672 | $63,300 | $8,000 | $55,300 |
| 2024 | $3,524 | $63,300 | $8,000 | $55,300 |
| 2023 | $3,524 | $63,300 | $8,000 | $55,300 |
| 2022 | $3,455 | $63,300 | $8,000 | $55,300 |
| 2021 | $3,515 | $63,300 | $8,000 | $55,300 |
| 2020 | $3,504 | $63,300 | $8,000 | $55,300 |
| 2019 | $3,447 | $63,300 | $8,000 | $55,300 |
| 2018 | $3,300 | $63,300 | $8,000 | $55,300 |
| 2017 | $3,137 | $63,300 | $8,000 | $55,300 |
| 2016 | $3,481 | $60,500 | $12,600 | $47,900 |
| 2015 | $3,468 | $60,500 | $12,600 | $47,900 |
| 2014 | $3,452 | $60,500 | $12,600 | $47,900 |
Source: Public Records
Map
Nearby Homes
Your Personal Tour Guide
Ask me questions while you tour the home.