306 Cherry St Port Byron, IL 61275
Port Byron AreaEstimated Value: $145,000 - $180,000
About This Home
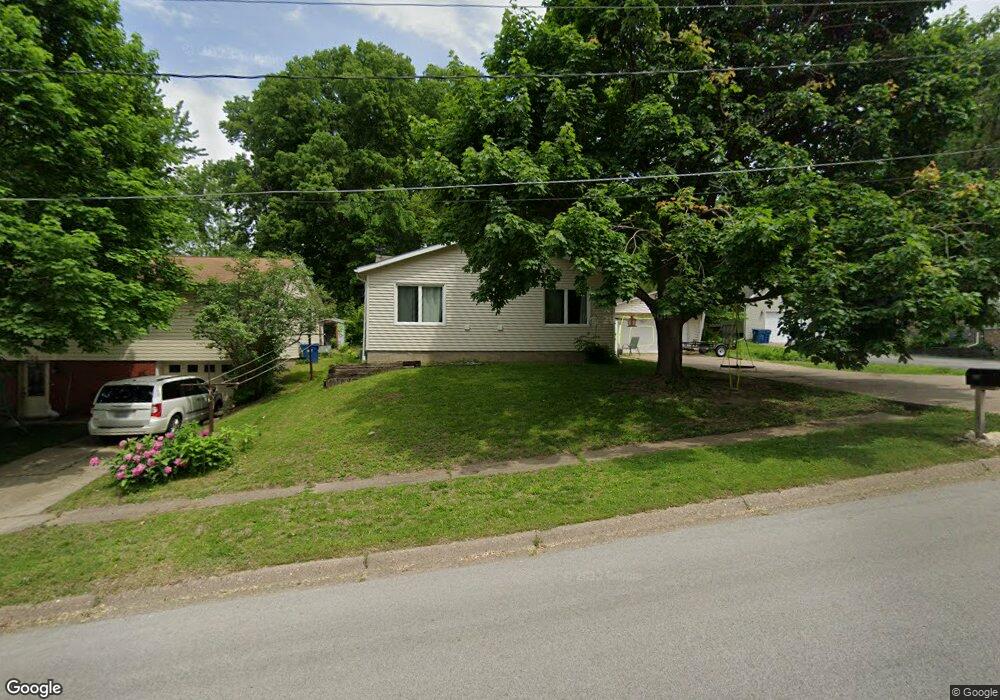
This home is located at 306 Cherry St, Port Byron, IL 61275 and is currently estimated at $169,248, approximately $129 per square foot. 306 Cherry St is a home located in Rock Island County with nearby schools including Riverdale Elementary School, Riverdale Middle School, and Riverdale Senior High School.
Ownership History
We collect this data history from publicly available records. To have your information removed, we recommend requesting removal directly through your county’s website.
Purchase Details
Home Financials for this Owner
Home Financials are based on the most recent Mortgage that was taken out on this home.Purchase Details
Home Values in the Area
Average Home Value in this Area
Purchase History
We collect this data history from publicly available records. To have your information removed, we recommend requesting removal directly through your county’s website.
| Date | Buyer | Sale Price | Title Company |
|---|---|---|---|
| $175,000 | None Listed On Document | ||
| $50,000 | Bozeman Neighbour Patton & Noe |
Mortgage History
We collect this data history from publicly available records. To have your information removed, we recommend requesting removal directly through your county’s website.
| Date | Status | Borrower | Loan Amount |
|---|---|---|---|
| Open | $75,000 |
Tax History
We collect this data history from publicly available records. To have your information removed, we recommend requesting removal directly through your county’s website.
| Year | Tax Paid | Tax Assessment Tax Assessment Total Assessment is a certain percentage of the fair market value that is determined by local assessors to be the total taxable value of land and additions on the property. | Land | Improvement |
|---|---|---|---|---|
| 2025 | $3,382 | $51,129 | $9,081 | $42,048 |
| 2024 | $3,382 | $48,235 | $8,567 | $39,668 |
| 2023 | $3,203 | $44,253 | $7,860 | $36,393 |
| 2022 | $3,006 | $44,188 | $7,496 | $36,692 |
| 2021 | $2,914 | $41,884 | $7,105 | $34,779 |
| 2020 | $2,863 | $41,265 | $7,000 | $34,265 |
| 2019 | $2,872 | $41,265 | $7,000 | $34,265 |
| 2018 | $2,695 | $39,675 | $4,866 | $34,809 |
| 2017 | $2,655 | $39,675 | $4,866 | $34,809 |
| 2016 | $2,625 | $39,127 | $4,799 | $34,328 |
| 2015 | $2,504 | $37,314 | $4,576 | $32,738 |
| 2014 | -- | $36,582 | $4,486 | $32,096 |
| 2013 | -- | $36,582 | $4,486 | $32,096 |
Map
- 302 N Main St
- 510 N Main St
- LOT 201 James St
- 802 N High St
- Lot A B C D N Cody Rd
- 124 Oak St
- 1225 N 2nd St
- 220 Benton St
- 629 N 3rd St
- 204 N 2nd St
- 211 Jones St
- 8230 217th St N
- 228 S 2nd St
- 327 Dodge St
- 425 Wisconsin St
- Lot 001 The Woods 8th St
- Lot 004 The Woods 8th St
- 2365 S High St
- 2 Frontier Ct
- 601 May St
Ask me questions while you tour the home.