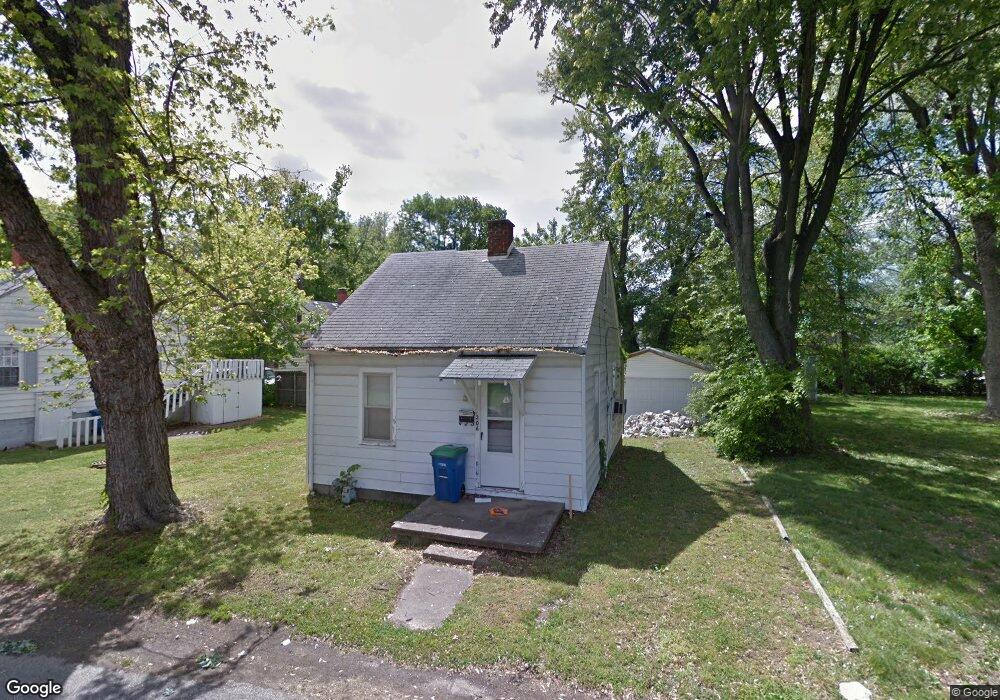
306 Sycamore St Newburgh, IN 47630
Estimated Value: $109,000 - $158,000
1
Bed
1
Bath
640
Sq Ft
$194/Sq Ft
Est. Value
About This Home
This home is located at 306 Sycamore St, Newburgh, IN 47630 and is currently estimated at $124,208, approximately $194 per square foot. 306 Sycamore St is a home located in Warrick County with nearby schools including Newburgh Elementary School, Castle North Middle School, and Castle High School.
Ownership History
Date
Name
Owned For
Owner Type
Purchase Details
Closed on
May 17, 2018
Sold by
Rogeron Properties Llc
Bought by
Kroeger Tyler L
Current Estimated Value
Home Financials for this Owner
Home Financials are based on the most recent Mortgage that was taken out on this home.
Original Mortgage
$41,800
Outstanding Balance
$11,065
Interest Rate
4.4%
Mortgage Type
New Conventional
Estimated Equity
$113,143
Purchase Details
Closed on
Sep 14, 2016
Sold by
Sale Billie Jean
Bought by
Rogeron Properties Llc
Create a Home Valuation Report for This Property
The Home Valuation Report is an in-depth analysis detailing your home's value as well as a comparison with similar homes in the area
Home Values in the Area
Average Home Value in this Area
Purchase History
We collect this data history from publicly available records. To have your information removed, we recommend requesting removal directly through your county’s website.
| Date | Buyer | Sale Price | Title Company |
|---|---|---|---|
| Kroeger Tyler L | -- | None Available | |
| Rogeron Properties Llc | -- | Attorney |
Source: Public Records
Mortgage History
We collect this data history from publicly available records. To have your information removed, we recommend requesting removal directly through your county’s website.
| Date | Status | Borrower | Loan Amount |
|---|---|---|---|
| Open | Kroeger Tyler L | $41,800 |
Source: Public Records
Tax History
| Year | Tax Paid | Tax Assessment Tax Assessment Total Assessment is a certain percentage of the fair market value that is determined by local assessors to be the total taxable value of land and additions on the property. | Land | Improvement |
|---|---|---|---|---|
| 2025 | $453 | $92,000 | $25,600 | $66,400 |
| 2024 | $257 | $89,900 | $36,600 | $53,300 |
| 2023 | $465 | $88,500 | $36,600 | $51,900 |
| 2022 | $281 | $67,900 | $12,200 | $55,700 |
| 2021 | $242 | $54,300 | $9,600 | $44,700 |
| 2020 | $251 | $55,800 | $9,600 | $46,200 |
| 2019 | $252 | $55,800 | $9,600 | $46,200 |
| 2018 | $216 | $49,600 | $9,600 | $40,000 |
| 2017 | $414 | $40,100 | $9,600 | $30,500 |
| 2016 | $859 | $42,800 | $9,600 | $33,200 |
| 2014 | $910 | $45,500 | $9,700 | $35,800 |
| 2013 | $902 | $46,100 | $9,700 | $36,400 |
Source: Public Records
Map
Nearby Homes
- 110 E Gray St
- 8 E Gray St
- 318 E Main St
- 0 W Jennings St
- 101 E Jennings St Unit E
- 305 E Jennings St
- 110 Monroe St
- 405 Filmore St
- 626 Monroe St
- 322 Shady Ln
- 630 E Main St
- 5666 N Cypress St
- 408 W Water St
- 706 Rose Dr
- 706 Village Ln
- 715 Carole Place
- 624 Forest Park Dr
- 5497 E Sherwood Dr
- 5233 State Route 261
- 8027 Wyngate Cir
- 114 E Gray St
- 106 E Gray St
- 314 Sycamore St
- 311 Middle St
- 307 Sycamore St
- 100 E Gray St
- 301 Sycamore St
- 113 E Gray St
- 7444 Middle Meadow Rd
- 318 Sycamore St
- 227 Middle St
- 311 Sycamore St
- 206 E Gray St
- 315 Sycamore St
- 220 Sycamore St
- 319 Middle St
- 221 Middle St
- 319 Sycamore St
- 216 Sycamore St
- 321 Sycamore St
Your Personal Tour Guide
Ask me questions while you tour the home.