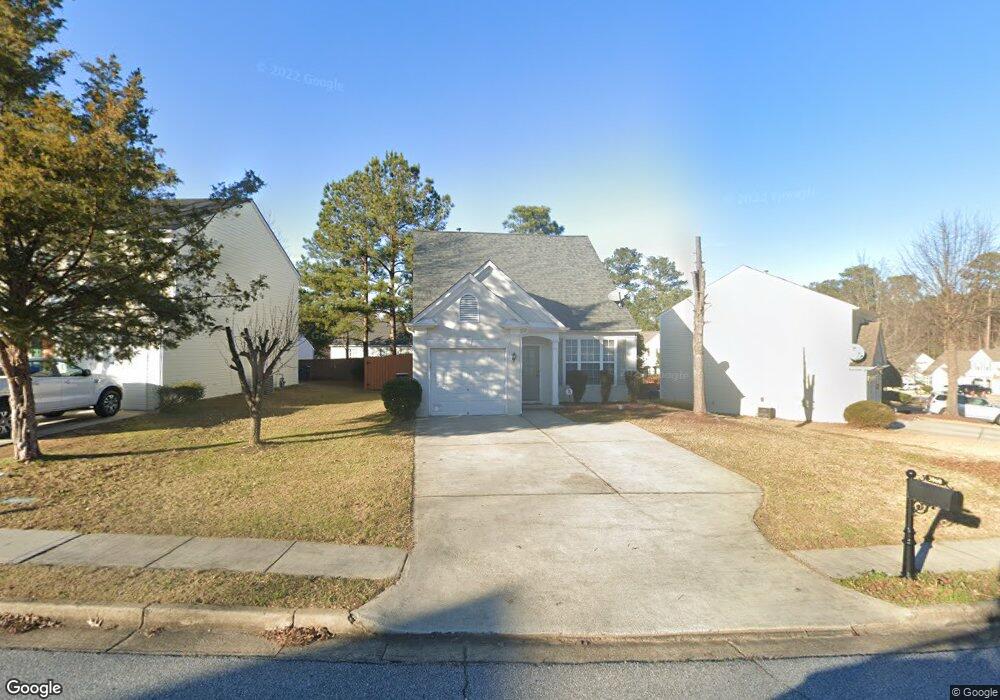
3060 Oxwell Dr Duluth, GA 30096
Estimated Value: $347,000 - $365,000
3
Beds
3
Baths
1,278
Sq Ft
$277/Sq Ft
Est. Value
About This Home
This home is located at 3060 Oxwell Dr, Duluth, GA 30096 and is currently estimated at $354,264, approximately $277 per square foot. 3060 Oxwell Dr is a home located in Gwinnett County with nearby schools including B.B. Harris Elementary School, Duluth Middle School, and Duluth High School.
Ownership History
Date
Name
Owned For
Owner Type
Purchase Details
Closed on
May 3, 2007
Sold by
United Guaranty Resid Ins
Bought by
Tseng Walk
Current Estimated Value
Purchase Details
Closed on
Dec 8, 2006
Sold by
Federal Home Loan Mortgage Corporation
Bought by
United Guaranty Resid Ins Co
Purchase Details
Closed on
Jul 5, 2006
Sold by
Wells Fargo Bk Na
Bought by
Federal Home Loan Mortgage Corporation
Purchase Details
Closed on
Aug 7, 2002
Sold by
Calilung Cristina M
Bought by
Deheer Patrick
Home Financials for this Owner
Home Financials are based on the most recent Mortgage that was taken out on this home.
Original Mortgage
$143,000
Interest Rate
5%
Mortgage Type
New Conventional
Purchase Details
Closed on
Feb 19, 1999
Sold by
Pulte Home Corp
Bought by
Calilung Cristina Marie
Home Financials for this Owner
Home Financials are based on the most recent Mortgage that was taken out on this home.
Original Mortgage
$118,150
Interest Rate
6.84%
Mortgage Type
New Conventional
Create a Home Valuation Report for This Property
The Home Valuation Report is an in-depth analysis detailing your home's value as well as a comparison with similar homes in the area
Home Values in the Area
Average Home Value in this Area
Purchase History
| Date | Buyer | Sale Price | Title Company |
|---|---|---|---|
| Tseng Walk | $157,000 | -- | |
| United Guaranty Resid Ins Co | -- | -- | |
| Federal Home Loan Mortgage Corporation | -- | -- | |
| Wells Fargo Bk Na | $140,374 | -- | |
| Deheer Patrick | $143,000 | -- | |
| Calilung Cristina Marie | $121,900 | -- |
Source: Public Records
Mortgage History
| Date | Status | Borrower | Loan Amount |
|---|---|---|---|
| Previous Owner | Deheer Patrick | $143,000 | |
| Previous Owner | Calilung Cristina Marie | $118,150 |
Source: Public Records
Tax History
| Year | Tax Paid | Tax Assessment Tax Assessment Total Assessment is a certain percentage of the fair market value that is determined by local assessors to be the total taxable value of land and additions on the property. | Land | Improvement |
|---|---|---|---|---|
| 2025 | $3,664 | $133,120 | $29,920 | $103,200 |
| 2024 | $3,672 | $127,360 | $30,000 | $97,360 |
| 2023 | $3,672 | $130,040 | $30,000 | $100,040 |
| 2022 | $2,654 | $80,000 | $18,000 | $62,000 |
| 2021 | $2,429 | $80,000 | $18,000 | $62,000 |
| 2020 | $2,703 | $84,800 | $18,000 | $66,800 |
| 2019 | $2,337 | $80,520 | $18,000 | $62,520 |
| 2018 | $2,433 | $71,120 | $14,800 | $56,320 |
| 2016 | $2,237 | $61,120 | $14,000 | $47,120 |
| 2015 | $1,968 | $52,680 | $14,000 | $38,680 |
| 2014 | $1,893 | $50,320 | $12,800 | $37,520 |
Source: Public Records
Map
Nearby Homes
- 3125 Oxwell Dr Unit IB
- 3215 Oxwell Dr Unit 1B
- 3412 Davenport Park Ln
- 3118 Hampton Ives Ct NW
- 2648 Irene Cir
- 3576 Randy Place
- 2708 Irene Cir
- 3593 Gainesway Ct
- 2816 Cardinal Lake Cir NW
- 2678 Hummingbird Dr NW
- 2251 Grovemont Dr
- 2830 Meadow Lark Trail
- 2829 Cardinal Trace
- 2878 Cardinal Trace
- 0 Davis Cir
- 2420 Honeycomb Way
- 3518 Tracey Dr
- 2347 Fawn Hollow Ct Unit 1
- 2934 Seagull Dr
- 3695 Woodberry Dr
- 3040 Oxwell Dr Unit 1B
- 3090 Oxwell Dr Unit IB
- 3030 Oxwell Dr
- 3065 Oxwell Dr
- 3055 Oxwell Dr
- 3075 Oxwell Dr Unit IB
- 3085 Oxwell Dr Unit 1B
- 3020 Oxwell Dr
- 2434 Oxwell Way
- 2444 Oxwell Way Unit 1
- 3095 Oxwell Dr
- 3110 Oxwell Dr Unit 1B
- 3045 Oxwell Dr Unit 1B
- 3105 Oxwell Dr
- 2454 Oxwell Way
- 3035 Oxwell Dr Unit 1
- 3010 Oxwell Dr Unit 1
- 3115 Oxwell Dr Unit 1B
- 2464 Oxwell Way
- 3025 Oxwell Dr
Your Personal Tour Guide
Ask me questions while you tour the home.