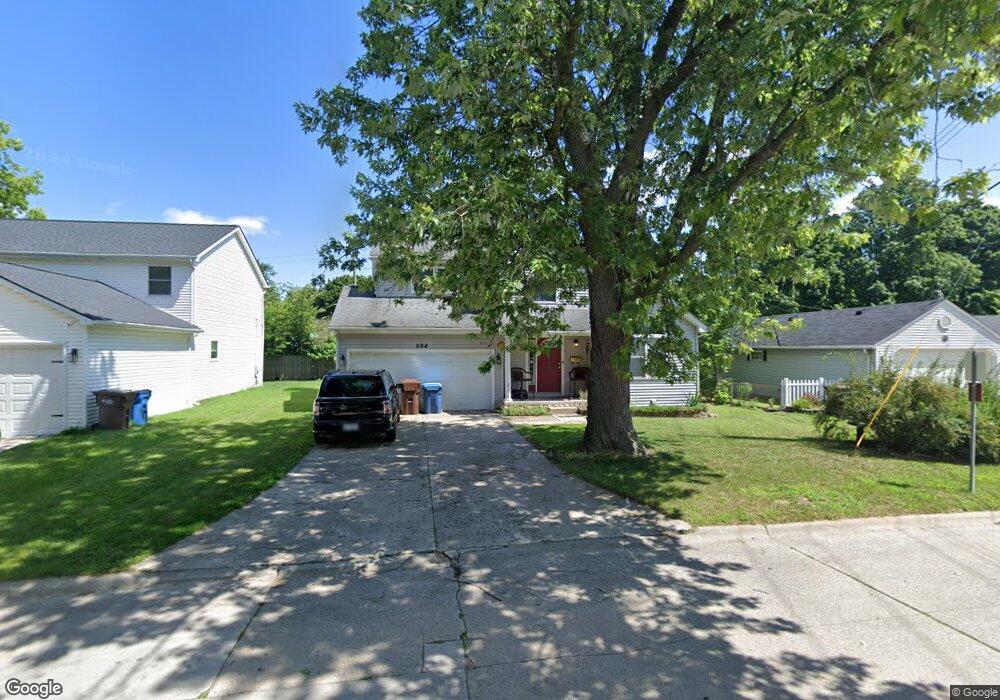
308 Edison Ave Belleville, MI 48111
Estimated Value: $380,000 - $506,771
3
Beds
3
Baths
2,000
Sq Ft
$216/Sq Ft
Est. Value
About This Home
This home is located at 308 Edison Ave, Belleville, MI 48111 and is currently estimated at $432,590, approximately $216 per square foot. 308 Edison Ave is a home located in Wayne County with nearby schools including Owen Intermediate School, Edgemont Elementary School, and McBride Middle School.
Ownership History
Date
Name
Owned For
Owner Type
Purchase Details
Closed on
Jun 12, 2024
Sold by
Alsobrook Bradford H and Bandli Ashley
Bought by
Bandli Thomas and Bandli Ashley
Current Estimated Value
Purchase Details
Closed on
Jun 27, 2011
Sold by
Secretary Of Housing & Urban Development
Bought by
Alsobrook Bradford
Purchase Details
Closed on
Jun 30, 2010
Sold by
Chase Home Finance Llc
Bought by
The Secretary Of Housing & Urban Develop
Purchase Details
Closed on
May 19, 2010
Sold by
Way Kari
Bought by
Chase Home Finance Llc
Purchase Details
Closed on
Mar 21, 2007
Sold by
Craig Josephine
Bought by
Federal National Mortgage Association
Purchase Details
Closed on
Apr 15, 2005
Sold by
J I C Enterprises Llc
Bought by
Craig Josephine
Purchase Details
Closed on
Apr 14, 2003
Sold by
Franks Raymond Arthur
Bought by
J I C Enterprises
Create a Home Valuation Report for This Property
The Home Valuation Report is an in-depth analysis detailing your home's value as well as a comparison with similar homes in the area
Home Values in the Area
Average Home Value in this Area
Purchase History
| Date | Buyer | Sale Price | Title Company |
|---|---|---|---|
| Bandli Thomas | -- | None Listed On Document | |
| Bandli Thomas | -- | None Listed On Document | |
| Bandli Thomas | -- | None Listed On Document | |
| Alsobrook Bradford | $72,000 | None Available | |
| The Secretary Of Housing & Urban Develop | -- | None Available | |
| Chase Home Finance Llc | $169,647 | None Available | |
| Federal National Mortgage Association | $200,474 | None Available | |
| Craig Josephine | $241,100 | Multiple | |
| J I C Enterprises | $110,500 | Multiple |
Source: Public Records
Tax History
| Year | Tax Paid | Tax Assessment Tax Assessment Total Assessment is a certain percentage of the fair market value that is determined by local assessors to be the total taxable value of land and additions on the property. | Land | Improvement |
|---|---|---|---|---|
| 2025 | $3,907 | $255,600 | $0 | $0 |
| 2024 | $6,613 | $219,100 | $0 | $0 |
| 2023 | $3,731 | $186,900 | $0 | $0 |
| 2022 | $6,310 | $174,000 | $0 | $0 |
| 2021 | $4,690 | $166,100 | $0 | $0 |
| 2020 | $4,647 | $154,100 | $0 | $0 |
| 2019 | $4,574 | $141,300 | $0 | $0 |
| 2018 | $3,218 | $113,200 | $0 | $0 |
| 2017 | $2,155 | $112,200 | $0 | $0 |
| 2016 | $4,069 | $104,200 | $0 | $0 |
| 2015 | $9,093 | $94,900 | $0 | $0 |
| 2013 | $9,431 | $101,400 | $0 | $0 |
| 2012 | $5,261 | $91,200 | $12,900 | $78,300 |
Source: Public Records
Map
Nearby Homes
- 14211 Laurelwood Dr Unit 60
- 14342 Laurelwood Dr
- 132 N Liberty St
- 129 South St
- 46940 Denton Rd
- 45669 Harmony Ln
- 46906 Timberland Dr
- 46747 Timberland Dr
- 46779 Timberland Dr
- 46968 Timberland Dr
- 46813 Timberland Dr
- 000 Savage Rd
- 46871 Timberland Dr
- 11808 Harbor Ln
- 47182 Timberland Dr
- 47089 Timberland Dr
- 47206 Timberland Dr
- 47127 Timberland Dr
- 47119 Lauren Ct
- 26 Carmell St
- 280 Edison Ave
- 312 Edison Ave
- 279 Brain Ave
- 307 Brain Ave
- 316 Edison Ave
- 305 Edison Ave
- 416 W Columbia Ave
- 315 Brain Ave
- 326 Edison Ave Unit Bldg-Unit
- 326 Edison Ave
- 430 W Columbia Ave
- 311 Edison Ave
- 335 Brain Ave
- 394 W Columbia Ave
- 336 Edison Ave
- 306 Brain Ave
- 440 W Columbia Ave
- 462 W Columbia Ave
- 462 W Columbia Ave
- 382 W Columbia Ave
Your Personal Tour Guide
Ask me questions while you tour the home.