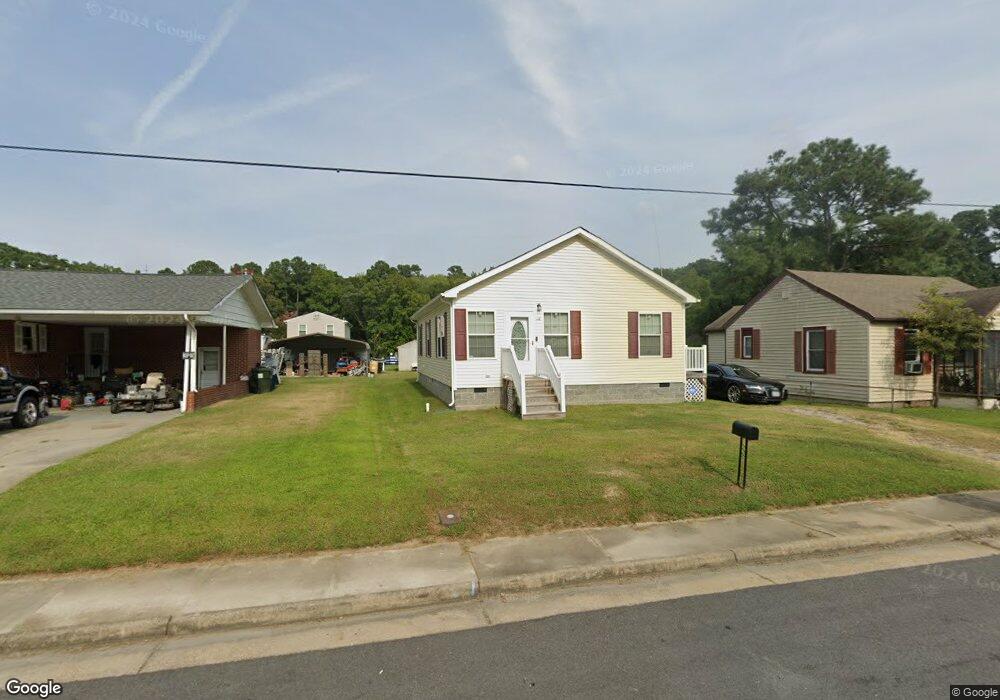
308 Middle St Smithfield, VA 23430
Estimated Value: $193,000 - $227,000
3
Beds
2
Baths
1,026
Sq Ft
$209/Sq Ft
Est. Value
About This Home
This home is located at 308 Middle St, Smithfield, VA 23430 and is currently estimated at $214,387, approximately $208 per square foot. 308 Middle St is a home located in Isle of Wight County with nearby schools including Hardy Elementary School, Smithfield Middle School, and Smithfield High School.
Ownership History
Date
Name
Owned For
Owner Type
Purchase Details
Closed on
Aug 22, 2018
Sold by
Hud & Housing Of Urban Dev
Bought by
Langhorne Victor
Current Estimated Value
Home Financials for this Owner
Home Financials are based on the most recent Mortgage that was taken out on this home.
Original Mortgage
$87,387
Outstanding Balance
$77,473
Interest Rate
5.5%
Mortgage Type
FHA
Estimated Equity
$136,914
Purchase Details
Closed on
Apr 26, 2013
Sold by
Williams Bruce W and Williams Virgie L
Purchase Details
Closed on
Jan 3, 1986
Create a Home Valuation Report for This Property
The Home Valuation Report is an in-depth analysis detailing your home's value as well as a comparison with similar homes in the area
Home Values in the Area
Average Home Value in this Area
Purchase History
We collect this data history from publicly available records. To have your information removed, we recommend requesting removal directly through your county’s website.
| Date | Buyer | Sale Price | Title Company |
|---|---|---|---|
| Langhorne Victor | $89,000 | -- | |
| -- | -- | -- | |
| -- | $15,000 | -- |
Source: Public Records
Mortgage History
We collect this data history from publicly available records. To have your information removed, we recommend requesting removal directly through your county’s website.
| Date | Status | Borrower | Loan Amount |
|---|---|---|---|
| Open | Langhorne Victor | $87,387 |
Source: Public Records
Tax History
| Year | Tax Paid | Tax Assessment Tax Assessment Total Assessment is a certain percentage of the fair market value that is determined by local assessors to be the total taxable value of land and additions on the property. | Land | Improvement |
|---|---|---|---|---|
| 2025 | $1,228 | $158,500 | $30,000 | $128,500 |
| 2024 | $1,157 | $158,500 | $30,000 | $128,500 |
| 2023 | $1,179 | $158,500 | $30,000 | $128,500 |
| 2022 | $1,126 | $126,100 | $25,000 | $101,100 |
| 2021 | $1,126 | $126,100 | $25,000 | $101,100 |
| 2020 | $1,126 | $126,100 | $25,000 | $101,100 |
| 2019 | $1,126 | $126,100 | $25,000 | $101,100 |
| 2018 | $991 | $110,200 | $25,000 | $85,200 |
| 2016 | $1,009 | $110,200 | $25,000 | $85,200 |
| 2015 | $957 | $110,200 | $25,000 | $85,200 |
| 2014 | $957 | $104,100 | $18,000 | $86,100 |
| 2013 | -- | $48,600 | $18,000 | $30,600 |
Source: Public Records
Map
Nearby Homes
Your Personal Tour Guide
Ask me questions while you tour the home.