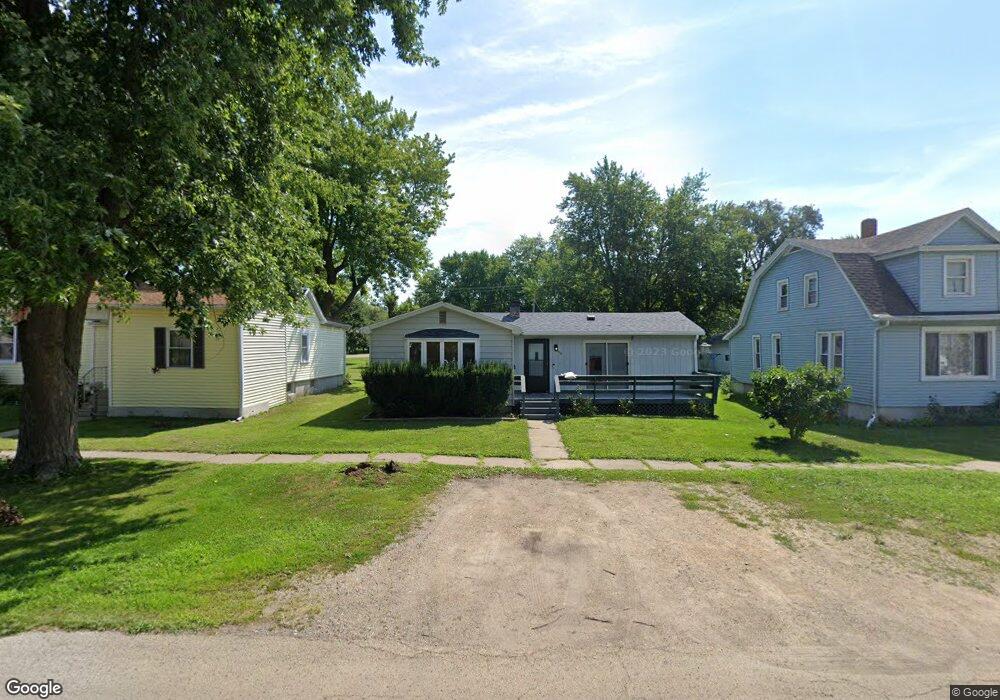
309 9th Ave Mendota, IL 61342
Estimated Value: $82,000 - $153,000
Studio
--
Bath
1,024
Sq Ft
$108/Sq Ft
Est. Value
About This Home
This home is located at 309 9th Ave, Mendota, IL 61342 and is currently estimated at $110,378, approximately $107 per square foot. 309 9th Ave is a home located in LaSalle County with nearby schools including Northbrook School, Blackstone Elementary School, and Lincoln Elementary School.
Ownership History
Date
Name
Owned For
Owner Type
Purchase Details
Closed on
Jun 24, 2024
Sold by
Carlos Juan M
Bought by
Casas Alejandro
Current Estimated Value
Purchase Details
Closed on
Jun 2, 2023
Sold by
Stevens Donna M
Bought by
Carlos Juan M
Purchase Details
Closed on
Dec 8, 2006
Sold by
Stevens Robert and Stevens Nancy
Bought by
Stevens Donna M
Home Financials for this Owner
Home Financials are based on the most recent Mortgage that was taken out on this home.
Original Mortgage
$70,000
Interest Rate
6.33%
Mortgage Type
New Conventional
Create a Home Valuation Report for This Property
The Home Valuation Report is an in-depth analysis detailing your home's value as well as a comparison with similar homes in the area
Home Values in the Area
Average Home Value in this Area
Purchase History
We collect this data history from publicly available records. To have your information removed, we recommend requesting removal directly through your county’s website.
| Date | Buyer | Sale Price | Title Company |
|---|---|---|---|
| Casas Alejandro | $71,000 | None Available | |
| Carlos Juan M | $71,000 | None Available | |
| Stevens Donna M | $70,000 | First American Title |
Source: Public Records
Mortgage History
We collect this data history from publicly available records. To have your information removed, we recommend requesting removal directly through your county’s website.
| Date | Status | Borrower | Loan Amount |
|---|---|---|---|
| Previous Owner | Stevens Donna M | $70,000 |
Source: Public Records
Tax History
| Year | Tax Paid | Tax Assessment Tax Assessment Total Assessment is a certain percentage of the fair market value that is determined by local assessors to be the total taxable value of land and additions on the property. | Land | Improvement |
|---|---|---|---|---|
| 2025 | $2,513 | $31,905 | $6,148 | $25,757 |
| 2024 | $2,513 | $29,159 | $5,619 | $23,540 |
| 2023 | $1,695 | $27,155 | $5,233 | $21,922 |
| 2022 | $1,504 | $24,629 | $4,771 | $19,858 |
| 2021 | $1,647 | $23,314 | $4,516 | $18,798 |
| 2020 | $1,517 | $22,013 | $4,264 | $17,749 |
| 2019 | $1,539 | $22,013 | $4,264 | $17,749 |
| 2018 | $1,531 | $21,531 | $4,171 | $17,360 |
| 2017 | $1,544 | $21,259 | $4,118 | $17,141 |
| 2016 | $1,466 | $20,354 | $3,943 | $16,411 |
| 2015 | $1,409 | $19,736 | $3,823 | $15,913 |
| 2012 | -- | $22,604 | $4,378 | $18,226 |
Source: Public Records
Map
Nearby Homes
Your Personal Tour Guide
Ask me questions while you tour the home.