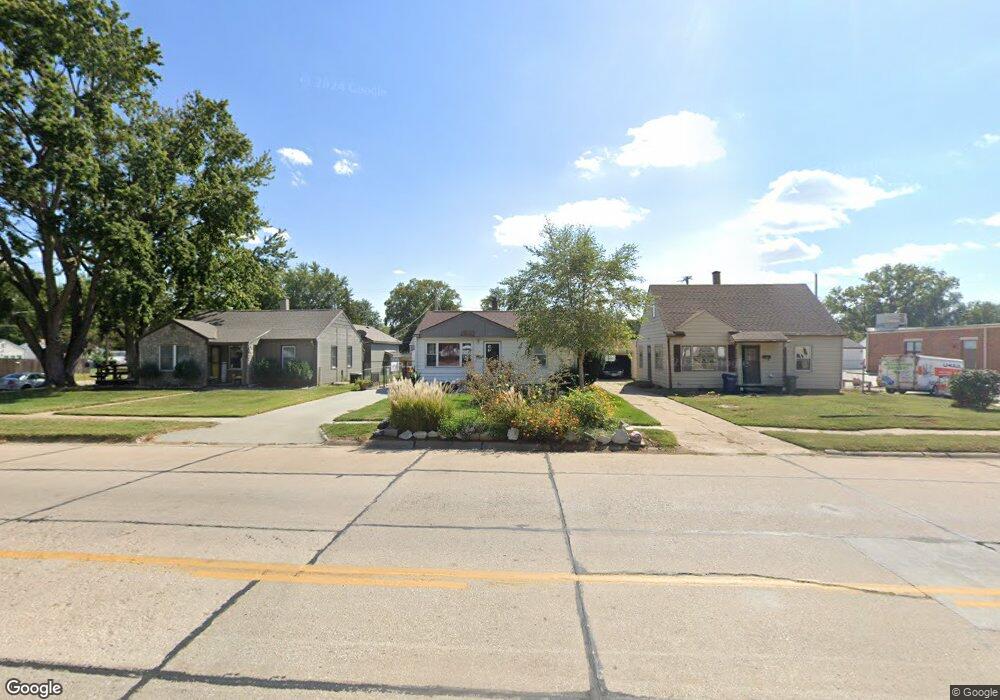
309 E Mission Ave Bellevue, NE 68005
Estimated Value: $175,000 - $198,000
2
Beds
1
Bath
734
Sq Ft
$252/Sq Ft
Est. Value
About This Home
This home is located at 309 E Mission Ave, Bellevue, NE 68005 and is currently estimated at $185,006, approximately $252 per square foot. 309 E Mission Ave is a home located in Sarpy County with nearby schools including Betz Elementary School, Bellevue Mission Middle School, and Bellevue East High School.
Create a Home Valuation Report for This Property
The Home Valuation Report is an in-depth analysis detailing your home's value as well as a comparison with similar homes in the area
Home Values in the Area
Average Home Value in this Area
Tax History
We collect this data history from publicly available records. To have your information removed, we recommend requesting removal directly through your county’s website.
| Year | Tax Paid | Tax Assessment Tax Assessment Total Assessment is a certain percentage of the fair market value that is determined by local assessors to be the total taxable value of land and additions on the property. | Land | Improvement |
|---|---|---|---|---|
| 2025 | $2,674 | $169,398 | $30,000 | $139,398 |
| 2024 | $2,950 | $153,134 | $25,000 | $128,134 |
| 2023 | $2,950 | $139,724 | $25,000 | $114,724 |
| 2022 | $2,644 | $122,856 | $20,000 | $102,856 |
| 2021 | $2,478 | $113,935 | $18,000 | $95,935 |
| 2020 | $2,290 | $104,925 | $18,000 | $86,925 |
| 2019 | $2,140 | $98,685 | $18,000 | $80,685 |
| 2018 | $2,041 | $96,663 | $18,000 | $78,663 |
| 2017 | $1,949 | $91,650 | $18,000 | $73,650 |
| 2016 | $1,817 | $87,342 | $18,000 | $69,342 |
| 2015 | $1,777 | $85,937 | $18,000 | $67,937 |
| 2014 | $1,805 | $86,706 | $18,000 | $68,706 |
| 2012 | -- | $89,686 | $18,000 | $71,686 |
Source: Public Records
Map
Nearby Homes
- 308 E Mission Ave
- 1908 Warren St
- 2519 Hancock St
- 1807 Warren St
- 2407 Washington St
- 2503 Washington St
- 307 E 17th Ave
- 411 W 22nd Ave
- 2406 Madison St
- 2802 Wayne St
- 406 Robinson Ave
- 1904 Freeman Dr
- 1403 Bluff St
- 404 W 30th Ave
- 902 W 24th Ave
- 900 Mclaughlin Cir
- 1308 Main St
- 3101 Washington St Unit 15
- 3101 Washington St Unit Lot 18
- 2707 Calhoun St
- 307 E Mission Ave
- 311 E Mission Ave
- 310 E 23rd Ave
- 308 E 23rd Ave
- 312 E 23rd Ave
- 306 E 23rd Ave
- 2228 Wilson Dr
- 401 E Mission Ave
- 2230 Wilson Dr
- 2231 Main St
- 310 E Mission Ave
- 312 E Mission Ave
- 306 E Mission Ave
- 2234 Wilson Dr
- 2213 Main St Unit 2215
- 2302 Warren St
- 2220 Main St
- 2301 Warren St
- 2227 Wilson Dr
- 2230 Main St
Your Personal Tour Guide
Ask me questions while you tour the home.