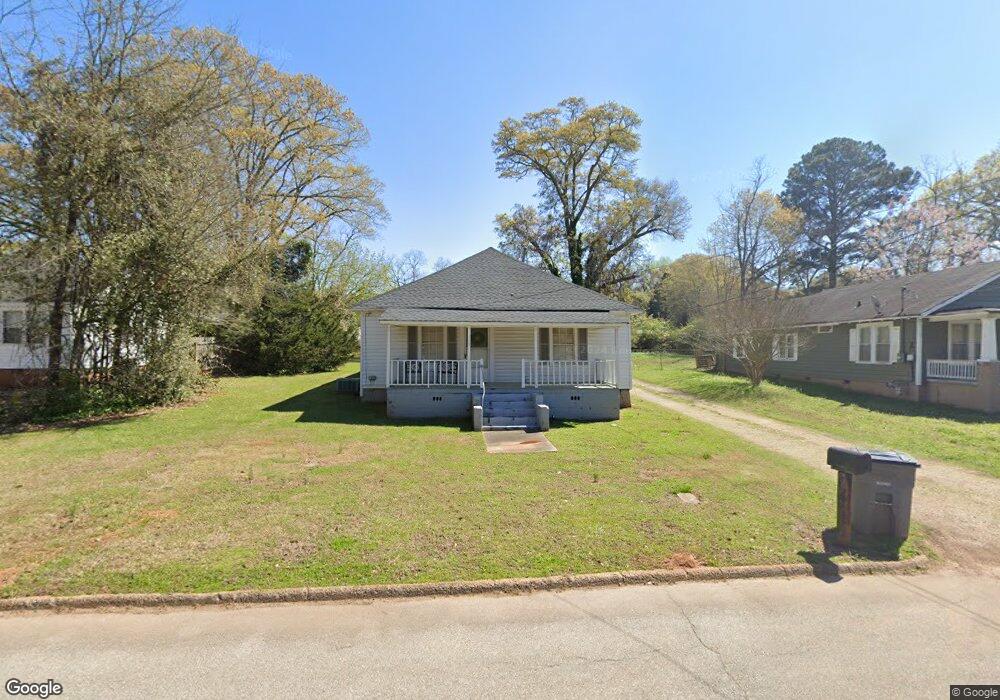
309 N Lee St Lagrange, GA 30240
Estimated Value: $152,052 - $163,000
2
Beds
2
Baths
1,380
Sq Ft
$114/Sq Ft
Est. Value
About This Home
This home is located at 309 N Lee St, Lagrange, GA 30240 and is currently estimated at $156,763, approximately $113 per square foot. 309 N Lee St is a home located in Troup County with nearby schools including Ethel W. Kight Elementary School, Hollis Hand Elementary School, and Franklin Forest Elementary School.
Ownership History
Date
Name
Owned For
Owner Type
Purchase Details
Closed on
Oct 4, 1995
Sold by
Hershall Davis R
Bought by
Yearta Phillip M
Current Estimated Value
Purchase Details
Closed on
May 1, 1987
Sold by
Gearhart Anthony L and Gearhart Kathy A
Bought by
Hershall Davis R
Purchase Details
Closed on
May 3, 1984
Sold by
Wanda David L and Wanda Kay Hume
Bought by
Gearhart Anthony L and Gearhart Kathy A
Purchase Details
Closed on
May 13, 1983
Sold by
Yates
Bought by
Wanda David L and Wanda Kay Hume
Purchase Details
Closed on
Jan 1, 1969
Sold by
Finney J H
Bought by
Yates
Create a Home Valuation Report for This Property
The Home Valuation Report is an in-depth analysis detailing your home's value as well as a comparison with similar homes in the area
Purchase History
| Date | Buyer | Sale Price | Title Company |
|---|---|---|---|
| Yearta Phillip M | $39,000 | -- | |
| Hershall Davis R | $30,000 | -- | |
| Gearhart Anthony L | $33,500 | -- | |
| Wanda David L | $30,000 | -- | |
| Yates | -- | -- |
Source: Public Records
Tax History
| Year | Tax Paid | Tax Assessment Tax Assessment Total Assessment is a certain percentage of the fair market value that is determined by local assessors to be the total taxable value of land and additions on the property. | Land | Improvement |
|---|---|---|---|---|
| 2025 | $1,529 | $56,080 | $10,000 | $46,080 |
| 2024 | $984 | $36,080 | $7,600 | $28,480 |
| 2023 | $940 | $34,480 | $7,600 | $26,880 |
| 2022 | $900 | $32,240 | $7,600 | $24,640 |
| 2021 | $818 | $27,120 | $7,600 | $19,520 |
| 2020 | $818 | $27,120 | $7,600 | $19,520 |
| 2019 | $754 | $25,000 | $7,600 | $17,400 |
| 2018 | $750 | $24,880 | $7,600 | $17,280 |
| 2017 | $750 | $24,880 | $7,600 | $17,280 |
| 2016 | $690 | $22,862 | $7,500 | $15,362 |
| 2015 | $694 | $22,970 | $7,608 | $15,362 |
| 2014 | $671 | $22,161 | $7,608 | $14,553 |
| 2013 | -- | $23,128 | $7,608 | $15,520 |
Source: Public Records
Map
Nearby Homes
Your Personal Tour Guide
Ask me questions while you tour the home.