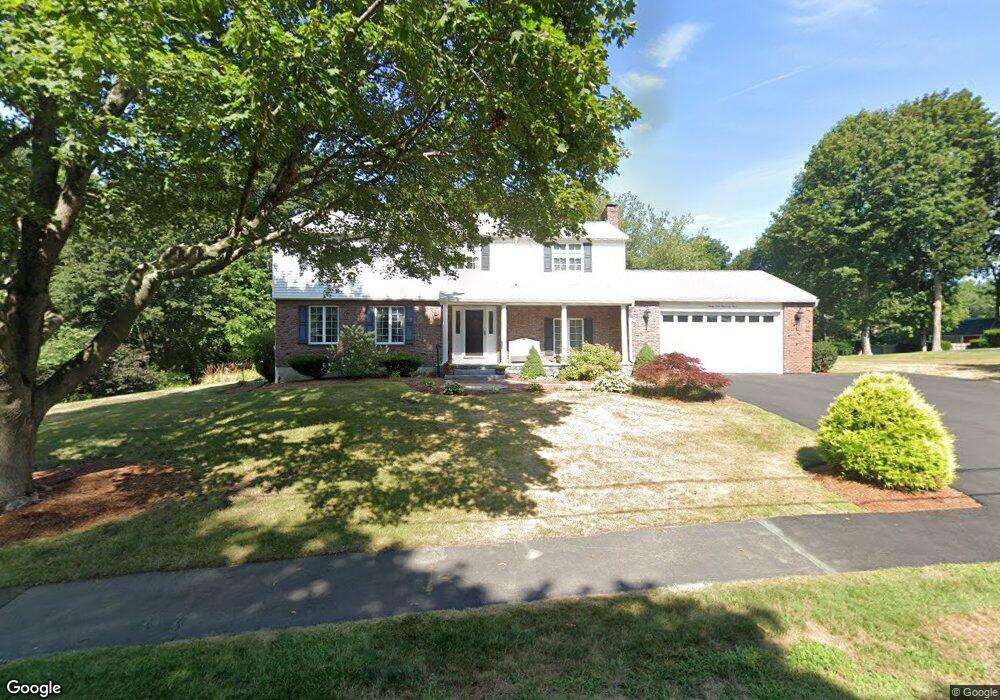
31 Bayberry Rd Danvers, MA 01923
Estimated Value: $888,000 - $1,088,000
4
Beds
3
Baths
3,386
Sq Ft
$288/Sq Ft
Est. Value
About This Home
This home is located at 31 Bayberry Rd, Danvers, MA 01923 and is currently estimated at $974,524, approximately $287 per square foot. 31 Bayberry Rd is a home located in Essex County with nearby schools including Danvers High School, St. Mary of the Annunciation School, and St. John's Prep.
Ownership History
Date
Name
Owned For
Owner Type
Purchase Details
Closed on
Mar 1, 2016
Sold by
Ciarcia Michael
Bought by
31 Bayberry Road Rt and Ciarcia
Current Estimated Value
Purchase Details
Closed on
Apr 28, 2014
Sold by
Ciarcia Joseph and Ciarcia Adeline G
Bought by
Ciarcia Michael
Home Financials for this Owner
Home Financials are based on the most recent Mortgage that was taken out on this home.
Original Mortgage
$400,000
Interest Rate
4.36%
Mortgage Type
New Conventional
Create a Home Valuation Report for This Property
The Home Valuation Report is an in-depth analysis detailing your home's value as well as a comparison with similar homes in the area
Home Values in the Area
Average Home Value in this Area
Purchase History
We collect this data history from publicly available records. To have your information removed, we recommend requesting removal directly through your county’s website.
| Date | Buyer | Sale Price | Title Company |
|---|---|---|---|
| 31 Bayberry Road Rt | -- | -- | |
| Ciarcia Michael | $511,000 | -- | |
| Ciarcia Michael | $511,000 | -- |
Source: Public Records
Mortgage History
We collect this data history from publicly available records. To have your information removed, we recommend requesting removal directly through your county’s website.
| Date | Status | Borrower | Loan Amount |
|---|---|---|---|
| Previous Owner | Ciarcia Michael | $400,000 |
Source: Public Records
Tax History
| Year | Tax Paid | Tax Assessment Tax Assessment Total Assessment is a certain percentage of the fair market value that is determined by local assessors to be the total taxable value of land and additions on the property. | Land | Improvement |
|---|---|---|---|---|
| 2025 | $9,363 | $852,000 | $405,100 | $446,900 |
| 2024 | $9,543 | $859,000 | $398,400 | $460,600 |
| 2023 | $9,165 | $780,000 | $364,600 | $415,400 |
| 2022 | $8,997 | $710,700 | $324,100 | $386,600 |
| 2021 | $8,824 | $661,000 | $320,100 | $340,900 |
| 2020 | $9,086 | $695,700 | $320,100 | $375,600 |
| 2019 | $8,705 | $655,500 | $290,400 | $365,100 |
| 2018 | $8,530 | $630,000 | $290,400 | $339,600 |
| 2017 | $8,063 | $568,200 | $249,900 | $318,300 |
| 2016 | $7,763 | $546,700 | $236,400 | $310,300 |
| 2015 | $7,546 | $506,100 | $216,100 | $290,000 |
Source: Public Records
Map
Nearby Homes
- 307 Maple St Unit 307
- 9 College Pond Dr
- 53 Summer St
- 146 Hobart St
- 77 Centre St
- 130 Pine St
- 35 Collins St Unit 88
- 8 Putnam St Unit 3
- 103 Newbury St Unit 1
- 96 Newbury St Unit 10B
- 98 Newbury St Unit 18B
- 98 Newbury St Unit 2B
- 98 Newbury St Unit 23B
- 4 Alden St Unit 3
- 97 Sylvan St Unit 7
- 62 Purchase St Unit C3
- 11 Macarthur Blvd Unit B
- 45 Abington Rd Unit 45
- 134 North St
- 95 Abington Rd Unit 95
Your Personal Tour Guide
Ask me questions while you tour the home.