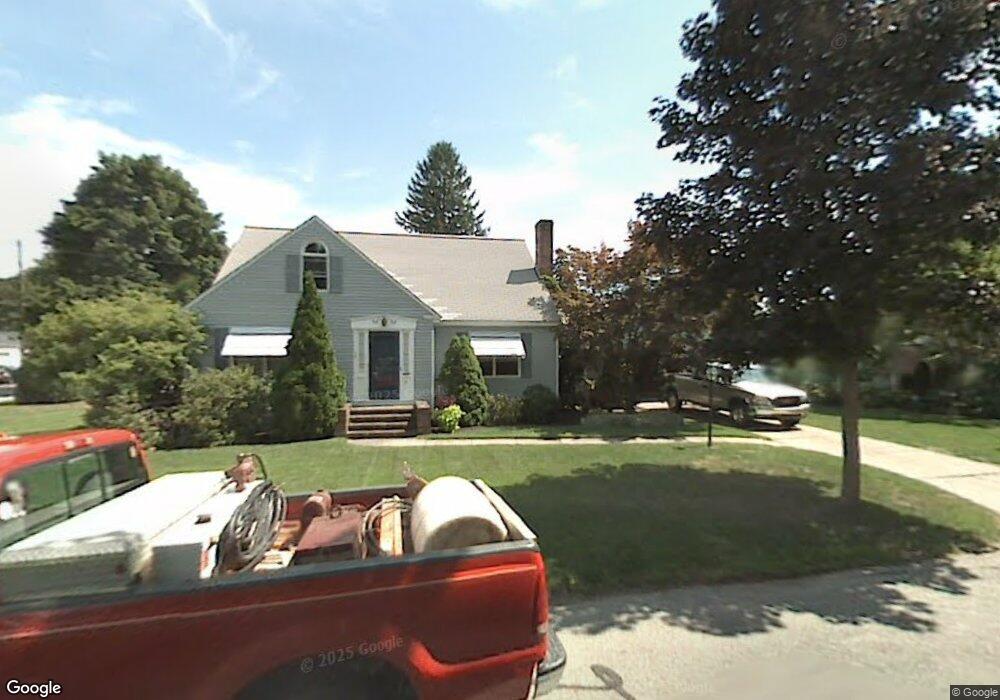
31 Belmont Ave Clinton, MA 01510
Clinton AreaEstimated Value: $498,000 - $558,080
About This Home
This home is located at 31 Belmont Ave, Clinton, MA 01510 and is currently estimated at $535,520, approximately $262 per square foot. 31 Belmont Ave is a home located in Worcester County with nearby schools including Clinton Elementary School, Clinton Senior High School, and Clinton Middle School.
Ownership History
We collect this data history from publicly available records. To have your information removed, we recommend requesting removal directly through your county’s website.
Purchase Details
Home Values in the Area
Average Home Value in this Area
Purchase History
We collect this data history from publicly available records. To have your information removed, we recommend requesting removal directly through your county’s website.
| Date | Buyer | Sale Price | Title Company |
|---|---|---|---|
| $116,000 | -- |
Mortgage History
We collect this data history from publicly available records. To have your information removed, we recommend requesting removal directly through your county’s website.
| Date | Status | Borrower | Loan Amount |
|---|---|---|---|
| Closed | $75,000 | ||
| Closed | $35,000 |
Tax History
We collect this data history from publicly available records. To have your information removed, we recommend requesting removal directly through your county’s website.
| Year | Tax Paid | Tax Assessment Tax Assessment Total Assessment is a certain percentage of the fair market value that is determined by local assessors to be the total taxable value of land and additions on the property. | Land | Improvement |
|---|---|---|---|---|
| 2025 | $6,468 | $486,300 | $120,400 | $365,900 |
| 2024 | $6,143 | $467,500 | $120,400 | $347,100 |
| 2023 | $5,645 | $422,200 | $109,400 | $312,800 |
| 2022 | $5,636 | $378,000 | $99,500 | $278,500 |
| 2021 | $5,252 | $329,500 | $94,700 | $234,800 |
| 2020 | $4,955 | $319,900 | $94,700 | $225,200 |
| 2019 | $5,053 | $317,200 | $92,000 | $225,200 |
| 2018 | $5,153 | $303,500 | $92,000 | $211,500 |
| 2017 | $4,649 | $263,100 | $92,000 | $171,100 |
| 2016 | $4,374 | $253,300 | $92,000 | $161,300 |
| 2015 | $4,312 | $258,800 | $89,300 | $169,500 |
| 2014 | $4,180 | $258,800 | $89,300 | $169,500 |
Map
- 227 Greeley St
- 70 Sterling St
- 103 Brook St Lot 2
- 103 Brook St
- 861 Main St
- 0 Parker Rd
- 155 Fitch Rd
- 78 Poulin Dr
- 719 Main St
- 55 Sterling St Unit 306
- 55 Sterling St Unit 112
- 55 Sterling St Unit 314
- 55 Sterling St Unit 208
- 55 Sterling St Unit 305
- 57 Clark St
- 59 S Meadow Rd
- 30 S Meadow Rd
- 78 - 80 West St
- 510 High St
- 520 High St Unit 7
Ask me questions while you tour the home.