31 Centre St Winthrop, MA 02152
Downtown Winthrop NeighborhoodEstimated Value: $675,000 - $769,994
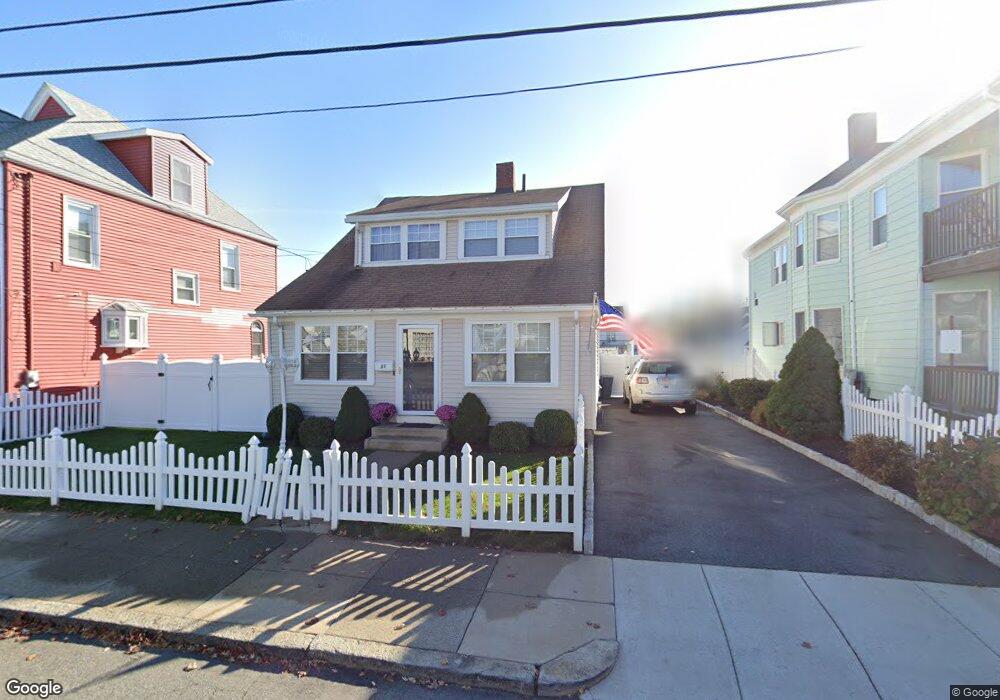
About This Home
This home is located at 31 Centre St, Winthrop, MA 02152 and is currently estimated at $731,749, approximately $448 per square foot. 31 Centre St is a home located in Suffolk County with nearby schools including William P. Gorman/Fort Banks Elementary School, Arthur T. Cummings Elementary School, and Winthrop Middle School.
Ownership History
We collect this data history from publicly available records. To have your information removed, we recommend requesting removal directly through your county’s website.
Purchase Details
Home Financials for this Owner
Home Financials are based on the most recent Mortgage that was taken out on this home.Purchase Details
Home Values in the Area
Average Home Value in this Area
Purchase History
We collect this data history from publicly available records. To have your information removed, we recommend requesting removal directly through your county’s website.
| Date | Buyer | Sale Price | Title Company |
|---|---|---|---|
| $406,000 | -- | ||
| $150,000 | -- |
Mortgage History
We collect this data history from publicly available records. To have your information removed, we recommend requesting removal directly through your county’s website.
| Date | Status | Borrower | Loan Amount |
|---|---|---|---|
| Open | $287,500 | ||
| Closed | $281,000 |
Tax History
We collect this data history from publicly available records. To have your information removed, we recommend requesting removal directly through your county’s website.
| Year | Tax Paid | Tax Assessment Tax Assessment Total Assessment is a certain percentage of the fair market value that is determined by local assessors to be the total taxable value of land and additions on the property. | Land | Improvement |
|---|---|---|---|---|
| 2025 | $7,074 | $685,500 | $343,300 | $342,200 |
| 2024 | $7,103 | $681,700 | $329,900 | $351,800 |
| 2023 | $6,588 | $615,700 | $302,000 | $313,700 |
| 2022 | $6,354 | $540,300 | $269,600 | $270,700 |
| 2021 | $6,301 | $496,900 | $240,700 | $256,200 |
| 2020 | $6,271 | $496,900 | $240,700 | $256,200 |
| 2019 | $6,143 | $466,100 | $221,800 | $244,300 |
| 2018 | $5,810 | $410,300 | $190,400 | $219,900 |
| 2017 | $5,366 | $372,400 | $168,500 | $203,900 |
| 2016 | $5,312 | $345,600 | $146,600 | $199,000 |
| 2015 | $4,825 | $336,500 | $142,300 | $194,200 |
| 2014 | $4,838 | $310,500 | $132,300 | $178,200 |
Map
- 5 Oceanview St
- 55 Banks St Unit 2
- 143 Morton St
- 105 Oceanview St
- 91 Marshall St
- 95 Marshall St
- 18-20 Fairview St
- 496 Winthrop St
- 24 Fairview St
- 300 Governors Dr Unit 21
- 800 Governors Dr Unit 6
- 1000 Governors Dr Unit 4
- 193 Winthrop St
- 70 Edgehill Rd
- 26 Shirley St Unit B
- 516 Pleasant St
- 550 Pleasant St Unit 411
- 117 Revere St
- 63-69 Putnam St
- 50 Main St
Ask me questions while you tour the home.