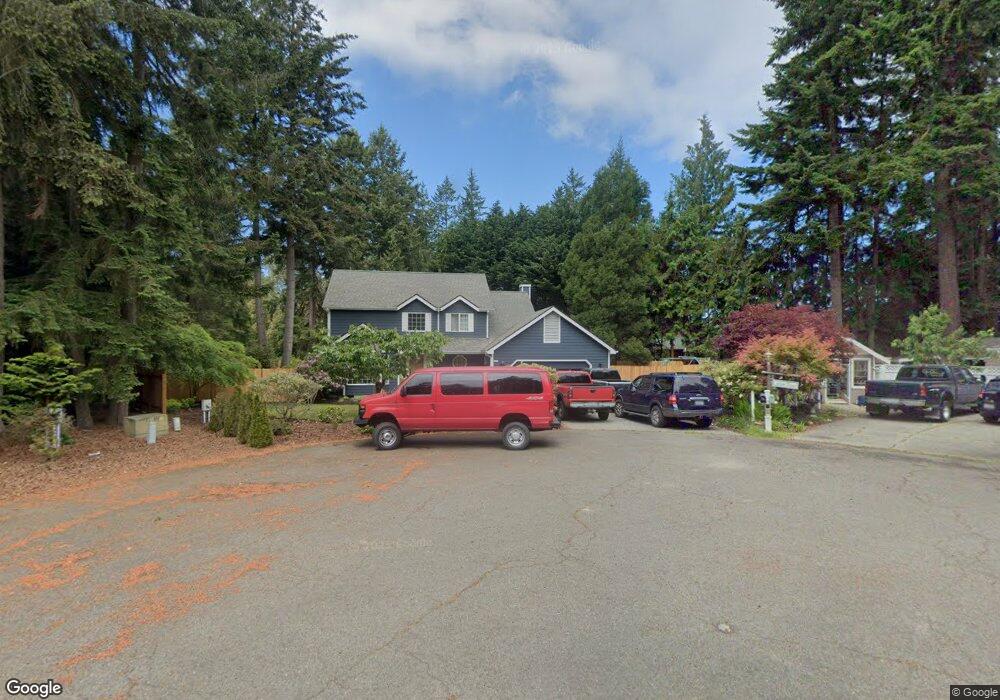
31 Edna Place Sequim, WA 98382
Estimated Value: $584,673 - $670,000
About This Home
This home is located at 31 Edna Place, Sequim, WA 98382 and is currently estimated at $628,558, approximately $574 per square foot. 31 Edna Place is a home located in Clallam County with nearby schools including Helen Haller Elementary School, Sequim Middle School, and Sequim Senior High School.
Ownership History
We collect this data history from publicly available records. To have your information removed, we recommend requesting removal directly through your county’s website.
Purchase Details
Home Financials for this Owner
Home Financials are based on the most recent Mortgage that was taken out on this home.Purchase Details
Home Financials for this Owner
Home Financials are based on the most recent Mortgage that was taken out on this home.Purchase Details
Home Financials for this Owner
Home Financials are based on the most recent Mortgage that was taken out on this home.Purchase History
We collect this data history from publicly available records. To have your information removed, we recommend requesting removal directly through your county’s website.
| Date | Buyer | Sale Price | Title Company |
|---|---|---|---|
| -- | Clallam Title Company | ||
| $345,000 | Clallam Title Company | ||
| $280,000 | None Available |
Mortgage History
We collect this data history from publicly available records. To have your information removed, we recommend requesting removal directly through your county’s website.
| Date | Status | Borrower | Loan Amount |
|---|---|---|---|
| Open | $328,220 | ||
| Previous Owner | $345,000 | ||
| Previous Owner | $140,000 |
Tax History
We collect this data history from publicly available records. To have your information removed, we recommend requesting removal directly through your county’s website.
| Year | Tax Paid | Tax Assessment Tax Assessment Total Assessment is a certain percentage of the fair market value that is determined by local assessors to be the total taxable value of land and additions on the property. | Land | Improvement |
|---|---|---|---|---|
| 2026 | $4,286 | $566,918 | $87,135 | $479,783 |
| 2025 | $4,061 | $542,102 | $87,135 | $454,967 |
| 2023 | $4,061 | $547,792 | $87,135 | $460,657 |
| 2022 | $3,623 | $512,007 | $72,705 | $439,302 |
| 2021 | $3,309 | $358,604 | $61,050 | $297,554 |
| 2020 | $3,561 | $358,604 | $61,050 | $297,554 |
| 2018 | $3,134 | $334,050 | $61,050 | $273,000 |
| 2017 | $2,627 | $280,772 | $55,500 | $225,272 |
| 2016 | $2,505 | $279,989 | $55,500 | $224,489 |
| 2015 | $2,584 | $260,386 | $55,500 | $204,886 |
| 2013 | $2,584 | $252,475 | $55,500 | $196,975 |
| 2012 | $2,584 | $259,875 | $62,900 | $196,975 |
Map
- 123 Forest Ridge Dr
- 193 Snowberry Ln
- 231 Madrona Terrace
- 235 Brittany Ln
- 3360 Woodcock Rd
- 180 Stonehaven Ln
- 163 Shepherds Way
- 73 Haywire Ln
- 431 Fasola Rd
- 995 Kirner Rd
- 131 Moonlight Dr
- 293 Moonlight Dr
- 999 Moonlight Dr
- 4596 Woodcock Rd
- 3718 Sequim Dungeness Way
- NKA Buttercup Ln
- 41 Northridge Ln
- 23 Pearl Place
- 366 Livengood Ln
- 93 Buttercup Ln
- 51 Forest Ridge Dr
- 131 Charles Way
- 141 Charles Way
- 30 Edna Place
- 31 Forest Ridge Dr
- 1182 Towne Rd
- 12 Edna Place
- 121 Charles Way
- 1162 Towne Rd
- 31 Charles Way
- 152 Charles Way
- 43 Charles Way
- 142 Charles Way
- 101 Charles Way
- 122 Charles Way
- 1232 Towne Rd
- 1191 Towne Rd
- 54 Forest Ridge Dr
- 112 Charles Way
- 92 Forest Ridge Dr
Ask me questions while you tour the home.