31 Eugene St Lowell, MA 01852
South Lowell NeighborhoodEstimated Value: $478,114 - $553,000
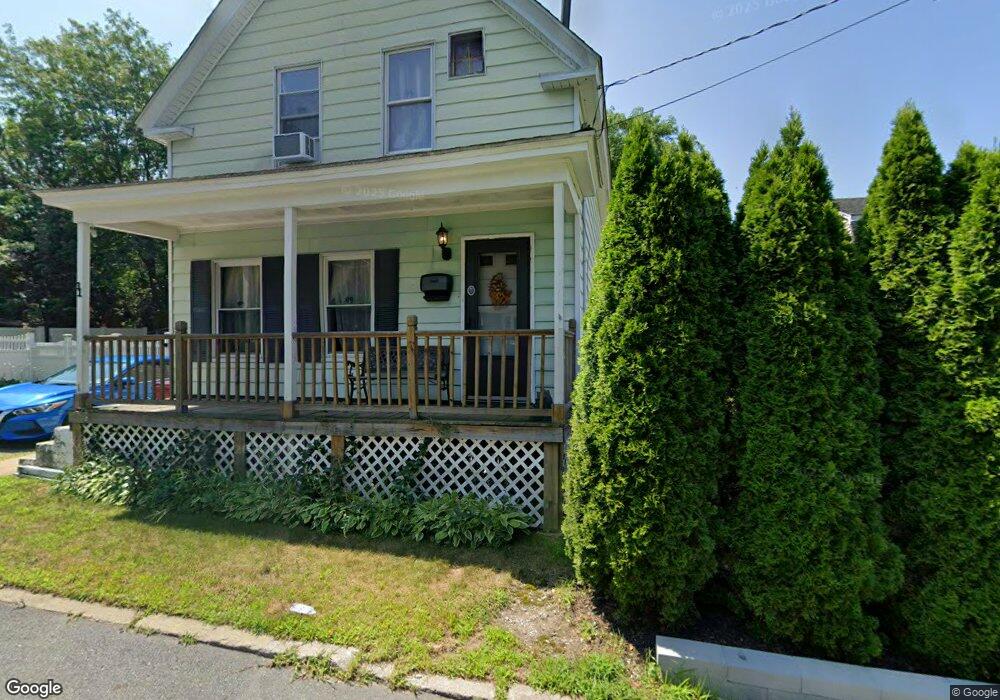
About This Home
This home is located at 31 Eugene St, Lowell, MA 01852 and is currently estimated at $517,029, approximately $347 per square foot. 31 Eugene St is a home located in Middlesex County with nearby schools including Moody Elementary School, Abraham Lincoln Elementary School, and Greenhalge Elementary School.
Ownership History
We collect this data history from publicly available records. To have your information removed, we recommend requesting removal directly through your county’s website.
Purchase Details
Purchase Details
Home Financials for this Owner
Home Financials are based on the most recent Mortgage that was taken out on this home.Purchase Details
Home Values in the Area
Average Home Value in this Area
Purchase History
We collect this data history from publicly available records. To have your information removed, we recommend requesting removal directly through your county’s website.
| Date | Buyer | Sale Price | Title Company |
|---|---|---|---|
| $239,900 | -- | ||
| $75,000 | -- | ||
| $75,000 | -- | ||
| $2,000 | -- | ||
| $2,000 | -- |
Mortgage History
We collect this data history from publicly available records. To have your information removed, we recommend requesting removal directly through your county’s website.
| Date | Status | Borrower | Loan Amount |
|---|---|---|---|
| Previous Owner | $71,250 |
Tax History
We collect this data history from publicly available records. To have your information removed, we recommend requesting removal directly through your county’s website.
| Year | Tax Paid | Tax Assessment Tax Assessment Total Assessment is a certain percentage of the fair market value that is determined by local assessors to be the total taxable value of land and additions on the property. | Land | Improvement |
|---|---|---|---|---|
| 2025 | $4,655 | $405,500 | $160,700 | $244,800 |
| 2024 | $4,538 | $381,000 | $150,200 | $230,800 |
| 2023 | $4,261 | $343,100 | $130,600 | $212,500 |
| 2022 | $3,954 | $311,600 | $118,700 | $192,900 |
| 2021 | $3,688 | $274,000 | $103,300 | $170,700 |
| 2020 | $3,480 | $260,500 | $98,200 | $162,300 |
| 2019 | $3,236 | $230,500 | $91,000 | $139,500 |
| 2018 | $3,166 | $220,000 | $86,700 | $133,300 |
| 2017 | $3,053 | $204,600 | $78,800 | $125,800 |
| 2016 | $2,792 | $184,200 | $68,900 | $115,300 |
| 2015 | $2,721 | $175,800 | $68,900 | $106,900 |
| 2013 | $2,580 | $171,900 | $76,900 | $95,000 |
Map
- 17 Suprenant St
- 1081 Lawrence St
- 32A Rockingham St Unit 32A
- 100 Roper St Unit D
- 6 Bristol St
- 55 Rumford St
- 85 Seneca St
- 357 Boylston St Unit 5
- 357 Boylston St Unit 3
- 53 Corbett St
- 1400 Gorham St Unit 42
- 238 Moore St
- 132 Commonwealth Ave
- 39 N Billerica Rd Unit 4
- 74 Carlisle St
- 7 Gorham St Unit 60
- 7 Gorham St Unit 57
- 50 Andrews St
- 29 Gorham St
- 48 Oak Knoll Rd
Ask me questions while you tour the home.