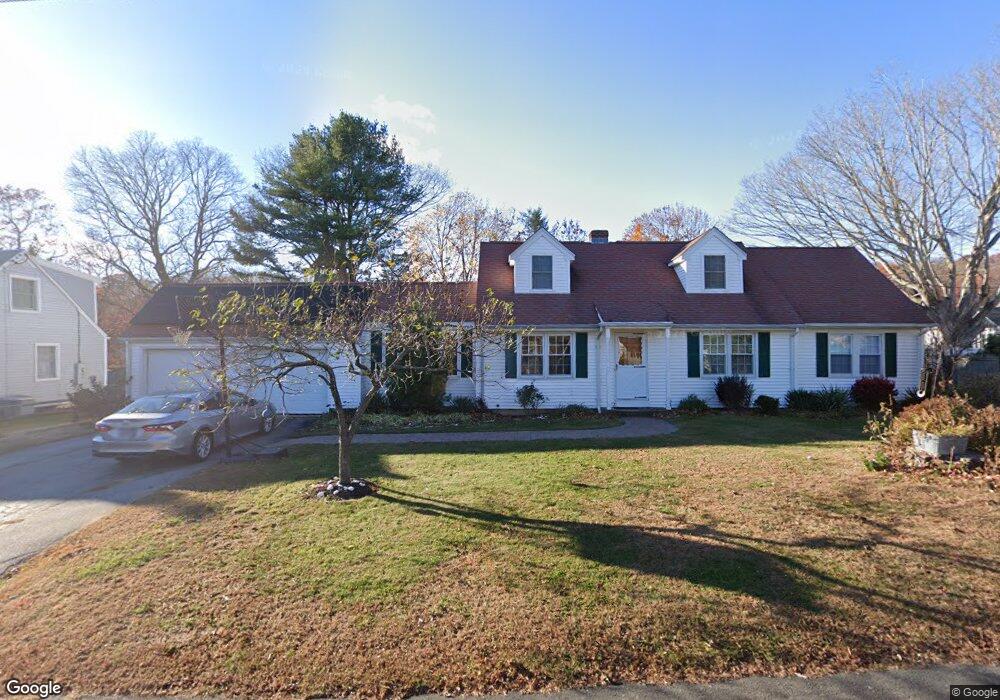
31 Huntley Ct Niantic, CT 06357
Estimated Value: $545,000 - $593,000
3
Beds
4
Baths
1,998
Sq Ft
$288/Sq Ft
Est. Value
About This Home
This home is located at 31 Huntley Ct, Niantic, CT 06357 and is currently estimated at $574,573, approximately $287 per square foot. 31 Huntley Ct is a home located in New London County with nearby schools including East Lyme Middle School, East Lyme High School, and Carelot Children's Center - East Lyme.
Ownership History
Date
Name
Owned For
Owner Type
Purchase Details
Closed on
Jan 5, 2017
Sold by
Coffey Daniel and Coffey Susan
Bought by
Smith Benjamin
Current Estimated Value
Home Financials for this Owner
Home Financials are based on the most recent Mortgage that was taken out on this home.
Original Mortgage
$218,450
Outstanding Balance
$179,558
Interest Rate
4.03%
Mortgage Type
New Conventional
Estimated Equity
$395,015
Purchase Details
Closed on
Apr 11, 1995
Sold by
Minucci Pamela J and Schultz Pamela J
Bought by
Smith Keith L and Smith Heather J
Create a Home Valuation Report for This Property
The Home Valuation Report is an in-depth analysis detailing your home's value as well as a comparison with similar homes in the area
Home Values in the Area
Average Home Value in this Area
Purchase History
We collect this data history from publicly available records. To have your information removed, we recommend requesting removal directly through your county’s website.
| Date | Buyer | Sale Price | Title Company |
|---|---|---|---|
| Smith Benjamin | $257,000 | -- | |
| Smith Keith L | $128,000 | -- | |
| Smith Benjamin | $257,000 | -- | |
| Smith Keith L | $128,000 | -- |
Source: Public Records
Mortgage History
We collect this data history from publicly available records. To have your information removed, we recommend requesting removal directly through your county’s website.
| Date | Status | Borrower | Loan Amount |
|---|---|---|---|
| Open | Smith Keith L | $218,450 | |
| Closed | Smith Keith L | $218,450 | |
| Previous Owner | Smith Keith L | $55,000 |
Source: Public Records
Tax History
| Year | Tax Paid | Tax Assessment Tax Assessment Total Assessment is a certain percentage of the fair market value that is determined by local assessors to be the total taxable value of land and additions on the property. | Land | Improvement |
|---|---|---|---|---|
| 2025 | $6,929 | $247,380 | $87,500 | $159,880 |
| 2024 | $6,518 | $247,380 | $87,500 | $159,880 |
| 2023 | $6,153 | $247,310 | $87,430 | $159,880 |
| 2022 | $5,896 | $247,310 | $87,430 | $159,880 |
| 2021 | $5,368 | $188,300 | $83,090 | $105,210 |
| 2020 | $5,340 | $188,300 | $83,090 | $105,210 |
| 2019 | $5,308 | $188,300 | $83,090 | $105,210 |
| 2018 | $5,150 | $188,300 | $83,090 | $105,210 |
| 2017 | $4,926 | $188,300 | $83,090 | $105,210 |
| 2016 | $4,665 | $183,960 | $78,750 | $105,210 |
| 2015 | $4,546 | $183,960 | $78,750 | $105,210 |
| 2014 | $4,421 | $183,960 | $78,750 | $105,210 |
Source: Public Records
Map
Nearby Homes
- 6 Slocum Dr
- 127 Black Point Rd Unit 31
- 5 Central Ave
- 12 Spinnaker Dr
- 150 Black Point Rd
- 97 W Main St Unit 5
- 14 Old Black Point Rd
- 61 Terrace Ave
- 3 Windward Dr
- 46 Old Black Point Rd
- 59 Corey Ln
- 47 Village Crossing Unit 47
- 11 Village Crossing Unit 11
- 46 Village Crossing Unit 46
- 43 Park Place
- 43 Village Crossing Unit 43
- 55 Corey Ln
- 4 Champlin Hill Ct
- 36 Attawan Rd
- 194 W Main St
Your Personal Tour Guide
Ask me questions while you tour the home.