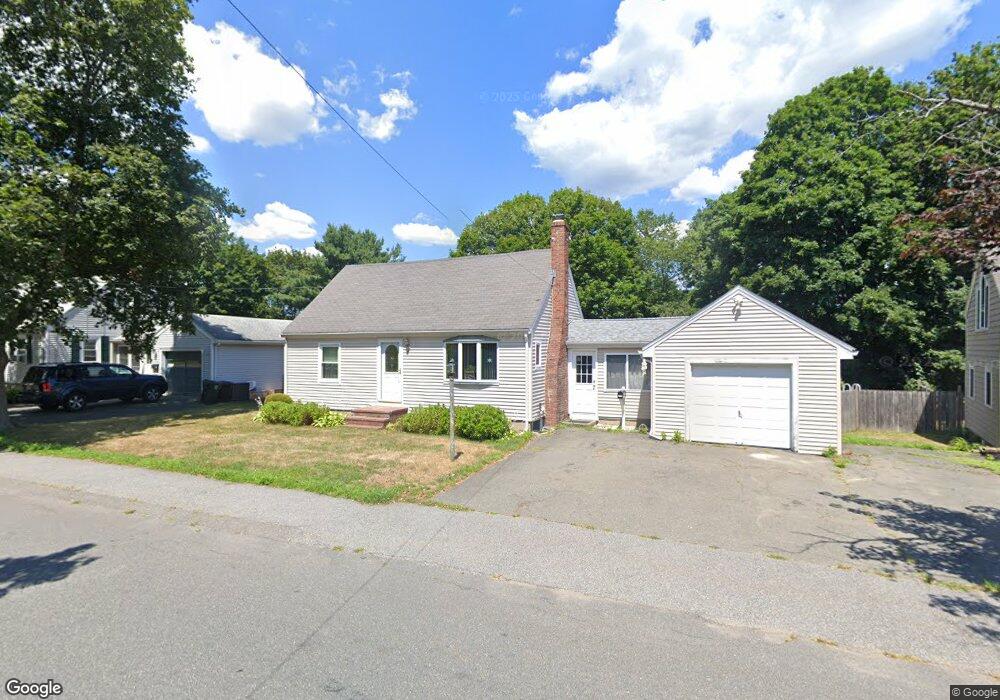
31 Hyde St Danvers, MA 01923
Danvers AreaEstimated Value: $558,000 - $734,000
About This Home
This home is located at 31 Hyde St, Danvers, MA 01923 and is currently estimated at $660,000, approximately $390 per square foot. 31 Hyde St is a home located in Essex County with nearby schools including Danvers High School, St. Mary of the Annunciation School, and Plumfield Academy.
Ownership History
We collect this data history from publicly available records. To have your information removed, we recommend requesting removal directly through your county’s website.
Purchase Details
Home Values in the Area
Average Home Value in this Area
Purchase History
We collect this data history from publicly available records. To have your information removed, we recommend requesting removal directly through your county’s website.
| Date | Buyer | Sale Price | Title Company |
|---|---|---|---|
| $154,000 | -- |
Mortgage History
We collect this data history from publicly available records. To have your information removed, we recommend requesting removal directly through your county’s website.
| Date | Status | Borrower | Loan Amount |
|---|---|---|---|
| Open | $50,000 | ||
| Open | $128,000 | ||
| Closed | $131,000 |
Tax History
We collect this data history from publicly available records. To have your information removed, we recommend requesting removal directly through your county’s website.
| Year | Tax Paid | Tax Assessment Tax Assessment Total Assessment is a certain percentage of the fair market value that is determined by local assessors to be the total taxable value of land and additions on the property. | Land | Improvement |
|---|---|---|---|---|
| 2025 | $6,612 | $601,600 | $344,300 | $257,300 |
| 2024 | $6,547 | $589,300 | $344,300 | $245,000 |
| 2023 | $6,252 | $532,100 | $312,900 | $219,200 |
| 2022 | $6,263 | $494,700 | $284,100 | $210,600 |
| 2021 | $6,057 | $453,700 | $269,200 | $184,500 |
| 2020 | $5,728 | $438,600 | $266,100 | $172,500 |
| 2019 | $5,470 | $411,900 | $242,100 | $169,800 |
| 2018 | $5,320 | $392,900 | $239,700 | $153,200 |
| 2017 | $4,999 | $352,300 | $209,700 | $142,600 |
| 2016 | $4,808 | $338,600 | $200,100 | $138,500 |
| 2015 | $4,721 | $316,600 | $182,100 | $134,500 |
Map
- 103 Sylvan St Unit 2
- 129 Collins St
- 98 Village Post Rd Unit 98
- 130 Pine St
- 137 Holten St
- 57 Sylvan St Unit 4F
- 57 Sylvan St Unit 3F
- 16 Adams St
- 10 Spruce St Unit B
- 96 Ash St
- 37 Constitution Ln Unit 115
- 0 Willowdale Ave Unit 73542976
- 8 Emery St
- 146 Hobart St
- 62 Purchase St Unit C3
- 3 Crane St
- 14 D'Orlando Way Unit 14
- 9 Park St Unit 1
- 6 Venice St Unit C2
- 22 Maple Ave
Ask me questions while you tour the home.