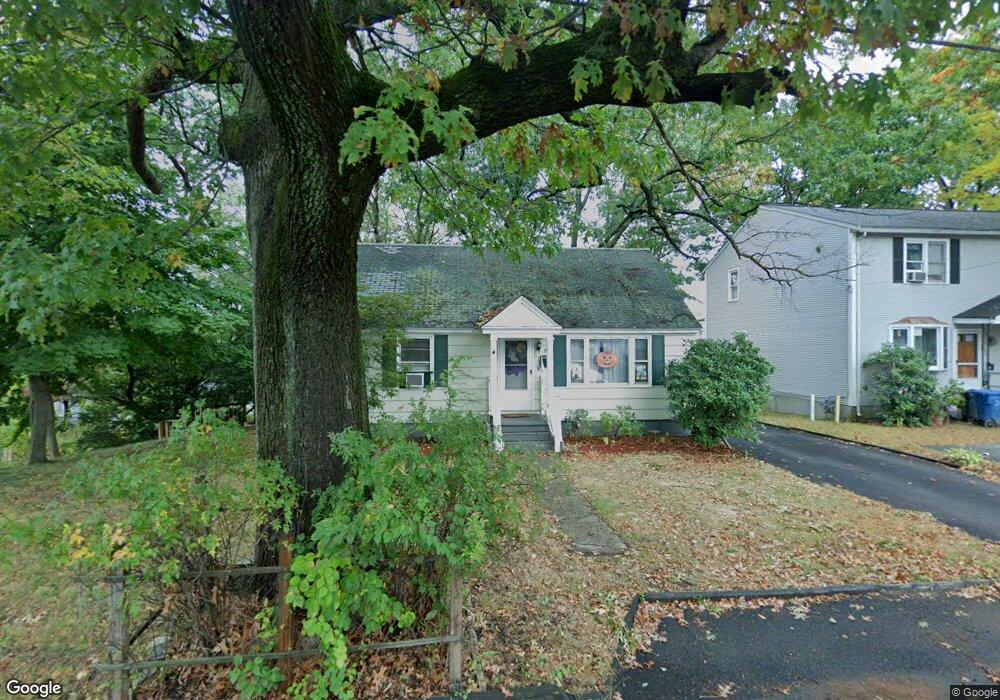
31 Kent St Lawrence, MA 01843
Colonial Heights NeighborhoodEstimated Value: $466,000 - $496,684
About This Home
This home is located at 31 Kent St, Lawrence, MA 01843 and is currently estimated at $486,921, approximately $368 per square foot. 31 Kent St is a home located in Essex County with nearby schools including John Breen School, South Lawrence East Elementary School, and School For Exceptional Studies.
Ownership History
We collect this data history from publicly available records. To have your information removed, we recommend requesting removal directly through your county’s website.
Purchase Details
Home Values in the Area
Average Home Value in this Area
Purchase History
We collect this data history from publicly available records. To have your information removed, we recommend requesting removal directly through your county’s website.
| Date | Buyer | Sale Price | Title Company |
|---|---|---|---|
| -- | -- |
Mortgage History
We collect this data history from publicly available records. To have your information removed, we recommend requesting removal directly through your county’s website.
| Date | Status | Borrower | Loan Amount |
|---|---|---|---|
| Closed | $10,000 | ||
| Closed | $57,000 |
Tax History
We collect this data history from publicly available records. To have your information removed, we recommend requesting removal directly through your county’s website.
| Year | Tax Paid | Tax Assessment Tax Assessment Total Assessment is a certain percentage of the fair market value that is determined by local assessors to be the total taxable value of land and additions on the property. | Land | Improvement |
|---|---|---|---|---|
| 2025 | $3,373 | $383,300 | $103,400 | $279,900 |
| 2024 | $3,363 | $363,600 | $111,900 | $251,700 |
| 2023 | $3,460 | $340,600 | $103,800 | $236,800 |
| 2022 | $3,323 | $290,500 | $94,100 | $196,400 |
| 2021 | $3,118 | $254,100 | $94,100 | $160,000 |
| 2020 | $3,025 | $243,400 | $89,200 | $154,200 |
| 2019 | $2,884 | $210,800 | $74,100 | $136,700 |
| 2018 | $2,725 | $190,300 | $70,200 | $120,100 |
| 2017 | $2,608 | $170,000 | $66,300 | $103,700 |
| 2016 | $2,469 | $159,200 | $54,600 | $104,600 |
| 2015 | $2,407 | $159,200 | $54,600 | $104,600 |
Map
- 5 Lafayette Ave
- 396-398 S Broadway
- 350 S Broadway
- 401 S Broadway
- 48 Chickering Rd
- 33 Garfield St
- 539-541 S Broadway
- 437 N Main St Unit C
- 134-136 Boxford St
- 199-205 Boxford St
- 36 Louisberg St
- 191 Farnham St
- 159 S Union St
- 17 Juliette St
- 27 Topping Rd
- 14 Tyler St Unit 1
- 25 Margate Rd
- 28 Elmwood St
- 350 Greene St Unit 306
- 23 Glenwood St
- 37 Lynn St
- 35 Lynn St
- 35 Lynn St Unit 35
- 35 Lynn St Unit 2
- 39 Lynn St
- 33 Lynn St
- 42 Kent St Unit 44
- 556 S Union St Unit 558
- 550 S Union St Unit 552
- 550-552 S Union St
- 38 Lynn St
- 32 Kent St
- 32 Kent St Unit 1
- 29 Lynn St
- 534 S Union St
- 30 Lynn St Unit 34
- 26 Lynn St
- 30 Kent St
- 37 Marlboro St
- 39 Marlboro St
Ask me questions while you tour the home.