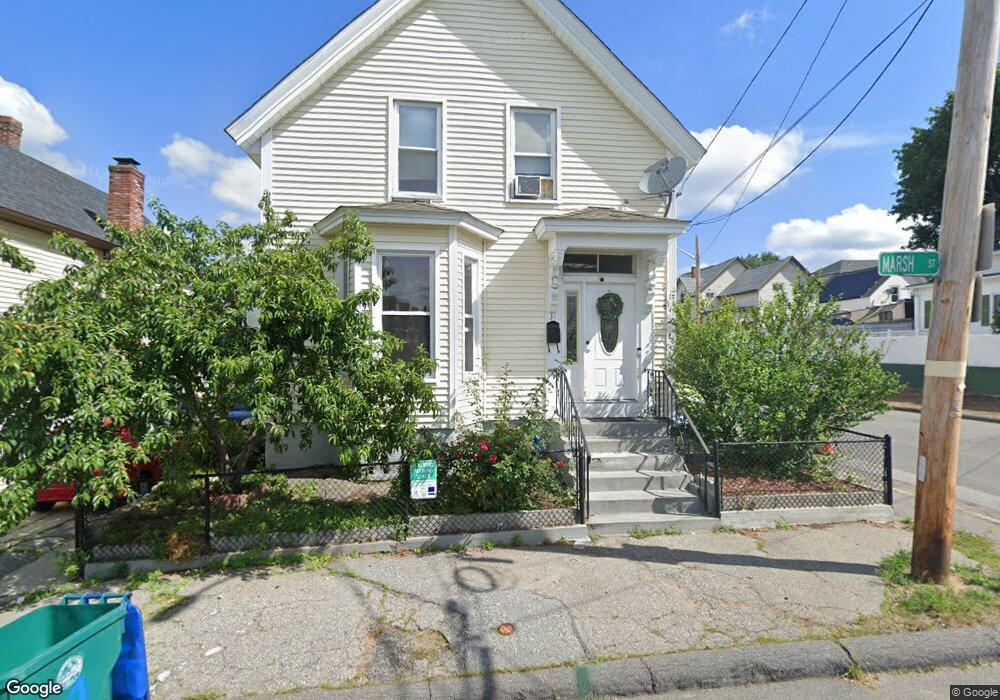
31 Marsh St Lowell, MA 01854
Acre NeighborhoodEstimated Value: $474,493 - $584,000
3
Beds
2
Baths
1,758
Sq Ft
$309/Sq Ft
Est. Value
About This Home
This home is located at 31 Marsh St, Lowell, MA 01854 and is currently estimated at $543,123, approximately $308 per square foot. 31 Marsh St is a home located in Middlesex County with nearby schools including Joseph McAvinnue Elementary School, Charlotte M. Murkland Elementary School, and Charles W. Morey Elementary School.
Ownership History
Date
Name
Owned For
Owner Type
Purchase Details
Closed on
Jun 16, 1995
Sold by
Doulamis Stylianos and Doulamis Georgia
Bought by
Rodriguez Martiniano
Current Estimated Value
Home Financials for this Owner
Home Financials are based on the most recent Mortgage that was taken out on this home.
Original Mortgage
$54,700
Interest Rate
8.24%
Mortgage Type
Purchase Money Mortgage
Create a Home Valuation Report for This Property
The Home Valuation Report is an in-depth analysis detailing your home's value as well as a comparison with similar homes in the area
Home Values in the Area
Average Home Value in this Area
Purchase History
| Date | Buyer | Sale Price | Title Company |
|---|---|---|---|
| Rodriguez Martiniano | $57,680 | -- | |
| Rodriguez Martiniano | $57,680 | -- |
Source: Public Records
Mortgage History
| Date | Status | Borrower | Loan Amount |
|---|---|---|---|
| Closed | Rodriguez Martiniano | $54,700 |
Source: Public Records
Tax History
| Year | Tax Paid | Tax Assessment Tax Assessment Total Assessment is a certain percentage of the fair market value that is determined by local assessors to be the total taxable value of land and additions on the property. | Land | Improvement |
|---|---|---|---|---|
| 2025 | $4,389 | $382,300 | $95,900 | $286,400 |
| 2024 | $4,084 | $342,900 | $89,600 | $253,300 |
| 2023 | $3,797 | $305,700 | $77,900 | $227,800 |
| 2022 | $3,515 | $277,000 | $70,800 | $206,200 |
| 2021 | $3,261 | $242,300 | $61,600 | $180,700 |
| 2020 | $2,930 | $219,300 | $52,600 | $166,700 |
| 2019 | $2,800 | $199,400 | $46,400 | $153,000 |
| 2018 | $2,609 | $181,300 | $44,200 | $137,100 |
| 2017 | $2,466 | $165,300 | $40,100 | $125,200 |
| 2016 | $2,506 | $165,300 | $40,100 | $125,200 |
| 2015 | $2,333 | $150,700 | $41,400 | $109,300 |
| 2013 | $2,360 | $157,200 | $55,000 | $102,200 |
Source: Public Records
Map
Nearby Homes
- 19 Oliver St
- 116 Walker St
- 113 School St Unit 12
- 1017 Middlesex St Unit 5
- 169 Salem St
- 3 Butman Place
- 312 Wilder St
- 491 Dutton St Unit 305
- 491 Dutton St Unit 409
- 491 Dutton St Unit 504
- 143 Westford St
- 45 Marshall St
- 70 Austin St Unit 15
- 38 Starbird St
- 187 Varnum Ave
- 129 Cabot St
- 68 Smith St
- 104 Woodward Ave
- 89 Mammoth Rd
- 45 Harvard St Unit 5 3rd fl
Your Personal Tour Guide
Ask me questions while you tour the home.