31 Martin St Wareham, MA 02532
Estimated Value: $413,396 - $509,000
About This Home
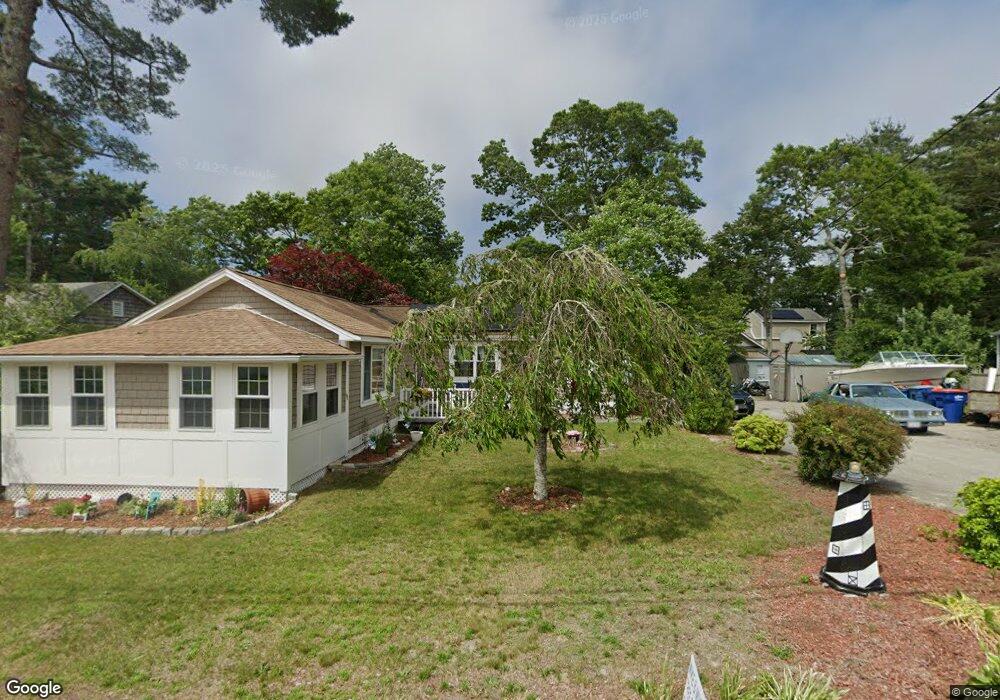
This home is located at 31 Martin St, Wareham, MA 02532 and is currently estimated at $459,099, approximately $382 per square foot. 31 Martin St is a home located in Plymouth County.
Ownership History
We collect this data history from publicly available records. To have your information removed, we recommend requesting removal directly through your county’s website.
Purchase Details
Purchase Details
Purchase Details
Home Financials for this Owner
Home Financials are based on the most recent Mortgage that was taken out on this home.Purchase Details
Purchase Details
Purchase History
We collect this data history from publicly available records. To have your information removed, we recommend requesting removal directly through your county’s website.
| Date | Buyer | Sale Price | Title Company |
|---|---|---|---|
| -- | -- | ||
| -- | -- | ||
| -- | -- | ||
| -- | -- | ||
| -- | -- | ||
| -- | -- | ||
| $174,000 | -- | ||
| $174,000 | -- | ||
| $130,000 | -- | ||
| $130,000 | -- |
Mortgage History
We collect this data history from publicly available records. To have your information removed, we recommend requesting removal directly through your county’s website.
| Date | Status | Borrower | Loan Amount |
|---|---|---|---|
| Previous Owner | $207,000 | ||
| Previous Owner | $199,650 |
Tax History
We collect this data history from publicly available records. To have your information removed, we recommend requesting removal directly through your county’s website.
| Year | Tax Paid | Tax Assessment Tax Assessment Total Assessment is a certain percentage of the fair market value that is determined by local assessors to be the total taxable value of land and additions on the property. | Land | Improvement |
|---|---|---|---|---|
| 2025 | $3,829 | $348,700 | $120,800 | $227,900 |
| 2024 | $3,788 | $324,300 | $94,400 | $229,900 |
| 2023 | $3,398 | $290,300 | $85,800 | $204,500 |
| 2022 | $3,398 | $249,500 | $85,800 | $163,700 |
| 2021 | $3,387 | $241,900 | $85,800 | $156,100 |
| 2020 | $3,142 | $229,200 | $85,800 | $143,400 |
| 2019 | $3,005 | $221,600 | $82,500 | $139,100 |
| 2018 | $2,676 | $190,600 | $82,500 | $108,100 |
| 2017 | $2,508 | $179,400 | $82,500 | $96,900 |
| 2016 | $2,299 | $163,200 | $79,800 | $83,400 |
| 2015 | $2,236 | $163,200 | $79,800 | $83,400 |
| 2014 | $2,344 | $176,400 | $79,800 | $96,600 |
Map
- 60 Martin St
- 17 Bungalow Ln
- 17 Bay Pointe Dr Extension Unit 17
- 8 Oakmont Dr Unit 8
- 49 Onset Ave
- 22 Long Neck Rd
- 8 Ash St
- 56 Rip Van Winkle Way
- 7 Buzzards Bay Dr
- 57 Onset Ave
- 3 Windmill Rd
- 38 Cahoon Rd Unit 38
- 29 Walnut St
- 109 Packard St
- 25 Nautical Way Unit E
- 25 Nautical Way Unit 25 E
- 4 Van Bummel Rd
- 54 Arlington Dr
- 106 Buzzards Bay Dr
- 9 F Hideaway Rd Unit 11
Ask me questions while you tour the home.