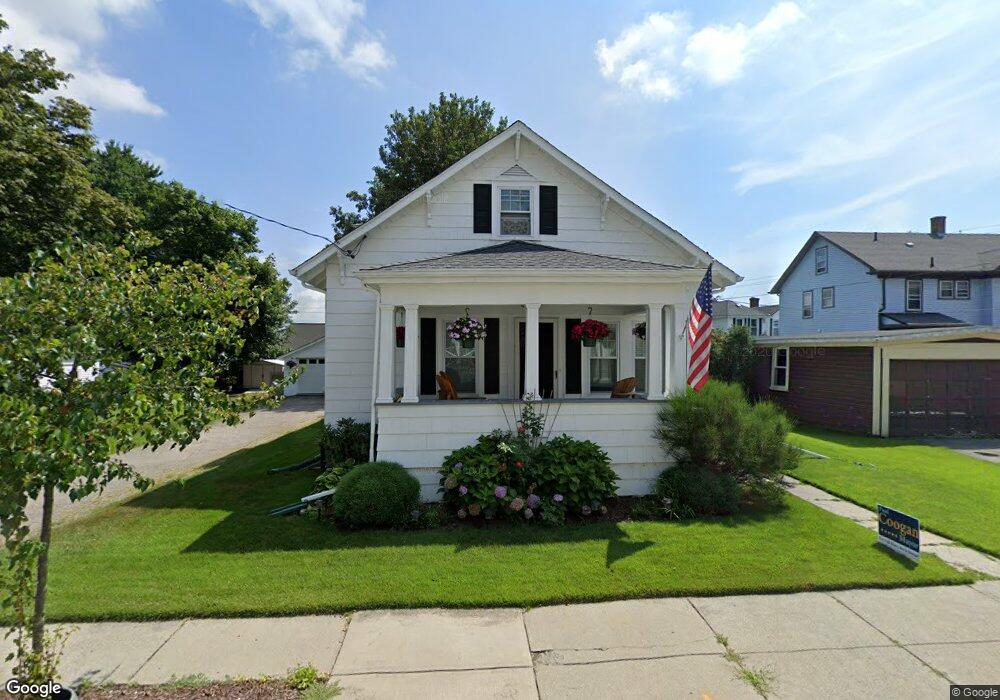
31 Moore St Fall River, MA 02720
Highlands-Fall River NeighborhoodEstimated Value: $401,094 - $473,000
4
Beds
1
Bath
1,277
Sq Ft
$333/Sq Ft
Est. Value
About This Home
This home is located at 31 Moore St, Fall River, MA 02720 and is currently estimated at $425,774, approximately $333 per square foot. 31 Moore St is a home located in Bristol County with nearby schools including Spencer Borden Elementary School, Morton Middle School, and B M C Durfee High School.
Ownership History
Date
Name
Owned For
Owner Type
Purchase Details
Closed on
Dec 11, 2012
Sold by
Morais Ft and Morais
Bought by
Prevost Raymond and Prevost Elizabeth A
Current Estimated Value
Home Financials for this Owner
Home Financials are based on the most recent Mortgage that was taken out on this home.
Original Mortgage
$179,500
Outstanding Balance
$121,770
Interest Rate
3.46%
Mortgage Type
New Conventional
Estimated Equity
$304,004
Purchase Details
Closed on
Jun 14, 2010
Sold by
Morais Anne and Morais Anne Marie
Bought by
Morais Ft and Morais
Purchase Details
Closed on
Jun 30, 2000
Sold by
Eiko Rt and Koch
Bought by
Morais Ann
Home Financials for this Owner
Home Financials are based on the most recent Mortgage that was taken out on this home.
Original Mortgage
$72,800
Interest Rate
8.59%
Mortgage Type
Purchase Money Mortgage
Create a Home Valuation Report for This Property
The Home Valuation Report is an in-depth analysis detailing your home's value as well as a comparison with similar homes in the area
Home Values in the Area
Average Home Value in this Area
Purchase History
We collect this data history from publicly available records. To have your information removed, we recommend requesting removal directly through your county’s website.
| Date | Buyer | Sale Price | Title Company |
|---|---|---|---|
| Prevost Raymond | $180,000 | -- | |
| Prevost Raymond | $180,000 | -- | |
| Morais Ft | -- | -- | |
| Morais Ft | -- | -- | |
| Morais Ann | $104,000 | -- |
Source: Public Records
Mortgage History
We collect this data history from publicly available records. To have your information removed, we recommend requesting removal directly through your county’s website.
| Date | Status | Borrower | Loan Amount |
|---|---|---|---|
| Open | Prevost Raymond | $179,500 | |
| Closed | Morais Ann | $179,500 | |
| Previous Owner | Morais Ann | $72,800 |
Source: Public Records
Tax History
| Year | Tax Paid | Tax Assessment Tax Assessment Total Assessment is a certain percentage of the fair market value that is determined by local assessors to be the total taxable value of land and additions on the property. | Land | Improvement |
|---|---|---|---|---|
| 2025 | $3,885 | $339,300 | $139,600 | $199,700 |
| 2024 | $3,691 | $321,200 | $134,300 | $186,900 |
| 2023 | $3,670 | $299,100 | $120,500 | $178,600 |
| 2022 | $3,311 | $262,400 | $111,600 | $150,800 |
| 2021 | $3,333 | $241,000 | $105,400 | $135,600 |
| 2020 | $3,156 | $218,400 | $101,400 | $117,000 |
| 2019 | $3,130 | $214,700 | $101,400 | $113,300 |
| 2018 | $3,101 | $212,100 | $101,400 | $110,700 |
| 2017 | $2,944 | $210,300 | $101,400 | $108,900 |
| 2016 | $2,794 | $205,000 | $101,400 | $103,600 |
| 2015 | $2,596 | $198,500 | $94,900 | $103,600 |
| 2014 | $2,497 | $198,500 | $94,900 | $103,600 |
Source: Public Records
Map
Nearby Homes
- 1163 New Boston Rd
- 1243 New Boston Rd
- 585 N Eastern Ave
- 0 Rich St
- 128 Windsor St
- 32 Oakland St
- 45 Read St
- 79 Woodlawn St
- 1231 Robeson St
- 235 Chavenson St
- 301 Madison St
- 37 Shawmut St
- 51 Summerfield St
- 47 Summerfield St
- 554 Madison St
- 166 Stonehaven Rd
- 1124 Bedford St
- 333 Langley St
- 243 Robeson St Unit 6
- 243 Robeson St Unit 3
- 53 Moore St
- 896 New Boston Rd
- 63 Moore St
- 874 New Boston Rd
- 886 New Boston Rd
- 886 New Boston Rd Unit 1
- 26 Elsbree St
- 910 New Boston Rd
- 42 Moore St
- 916 New Boston Rd
- 24 Moore St
- 926 New Boston Rd
- 60 Moore St
- 854 New Boston Rd
- 854 New Boston Rd Unit 2
- 854 New Boston Rd Unit 1
- 58 Elsbree St
- 257 Rathgar St
- 881 New Boston Rd
- 903 New Boston Rd
Your Personal Tour Guide
Ask me questions while you tour the home.