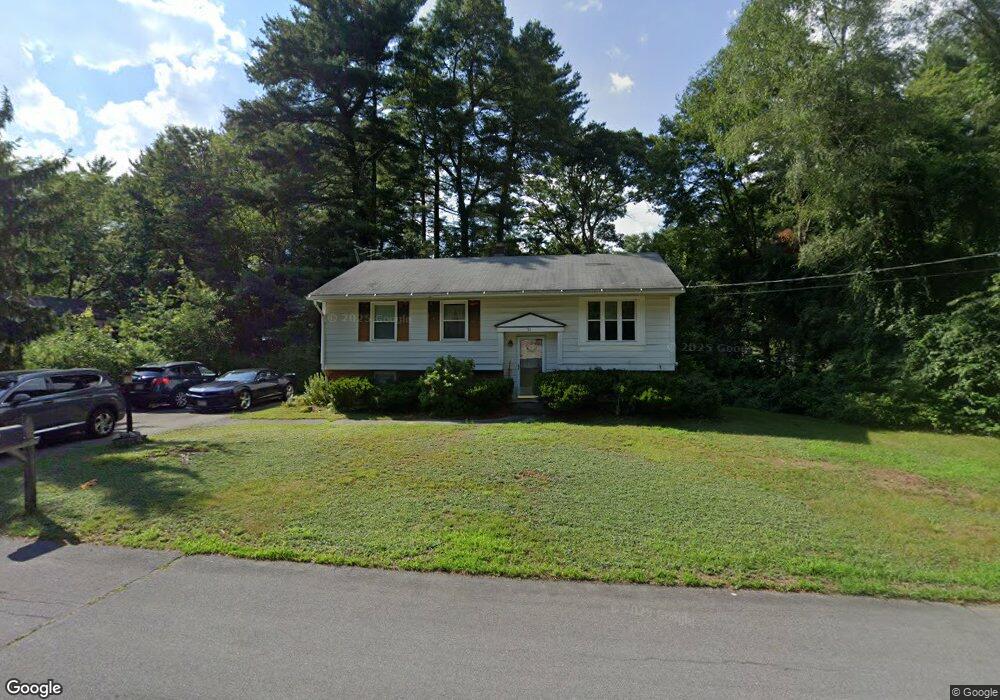
31 Shirley Rd Stoughton, MA 02072
Estimated Value: $521,978 - $612,000
3
Beds
1
Bath
1,438
Sq Ft
$395/Sq Ft
Est. Value
About This Home
This home is located at 31 Shirley Rd, Stoughton, MA 02072 and is currently estimated at $567,995, approximately $394 per square foot. 31 Shirley Rd is a home located in Norfolk County with nearby schools including South Elementary School, O'Donnell Middle School, and Stoughton High School.
Ownership History
Date
Name
Owned For
Owner Type
Purchase Details
Closed on
Jul 29, 2025
Sold by
Cormier Dennis E and Cormier Sharon A
Bought by
Dennis Edward Cormier Lt and Cormier
Current Estimated Value
Purchase Details
Closed on
Sep 15, 1975
Bought by
Cormier Dennis E and Cormier Sharon A
Create a Home Valuation Report for This Property
The Home Valuation Report is an in-depth analysis detailing your home's value as well as a comparison with similar homes in the area
Home Values in the Area
Average Home Value in this Area
Purchase History
We collect this data history from publicly available records. To have your information removed, we recommend requesting removal directly through your county’s website.
| Date | Buyer | Sale Price | Title Company |
|---|---|---|---|
| Dennis Edward Cormier Lt | -- | -- | |
| Cormier Dennis E | -- | -- |
Source: Public Records
Mortgage History
We collect this data history from publicly available records. To have your information removed, we recommend requesting removal directly through your county’s website.
| Date | Status | Borrower | Loan Amount |
|---|---|---|---|
| Previous Owner | Cormier Dennis E | $84,000 |
Source: Public Records
Tax History
| Year | Tax Paid | Tax Assessment Tax Assessment Total Assessment is a certain percentage of the fair market value that is determined by local assessors to be the total taxable value of land and additions on the property. | Land | Improvement |
|---|---|---|---|---|
| 2025 | $5,747 | $464,200 | $224,100 | $240,100 |
| 2024 | $5,558 | $436,600 | $204,700 | $231,900 |
| 2023 | $5,345 | $394,500 | $187,100 | $207,400 |
| 2022 | $5,268 | $365,600 | $180,000 | $185,600 |
| 2021 | $5,007 | $331,600 | $158,800 | $172,800 |
| 2020 | $4,832 | $324,500 | $158,800 | $165,700 |
| 2019 | $5,033 | $328,100 | $158,800 | $169,300 |
| 2018 | $4,400 | $297,100 | $151,800 | $145,300 |
| 2017 | $4,215 | $290,900 | $150,000 | $140,900 |
| 2016 | $4,022 | $268,700 | $135,900 | $132,800 |
| 2015 | $3,958 | $261,600 | $128,800 | $132,800 |
| 2014 | $3,841 | $244,000 | $118,200 | $125,800 |
Source: Public Records
Map
Nearby Homes
- 29 Anderson Rd
- 31 Jones Terrace Unit 22
- 56 3rd St
- 830 Washington St Unit 1
- 78 Bird St
- 882 Park St
- 10 Porter St Unit C
- 75 Erica Dr
- 138 Water St
- 88 Pearl St
- 19 Voses Ct
- 46 Britton Ave
- 132 Winslow Dr
- 0 Britton Ave
- 39 Brewster Rd
- 715 Central St
- 438 School St
- 24 Warren Ave
- 65 Mccormick Terrace Unit 10
- 114 South St
Your Personal Tour Guide
Ask me questions while you tour the home.