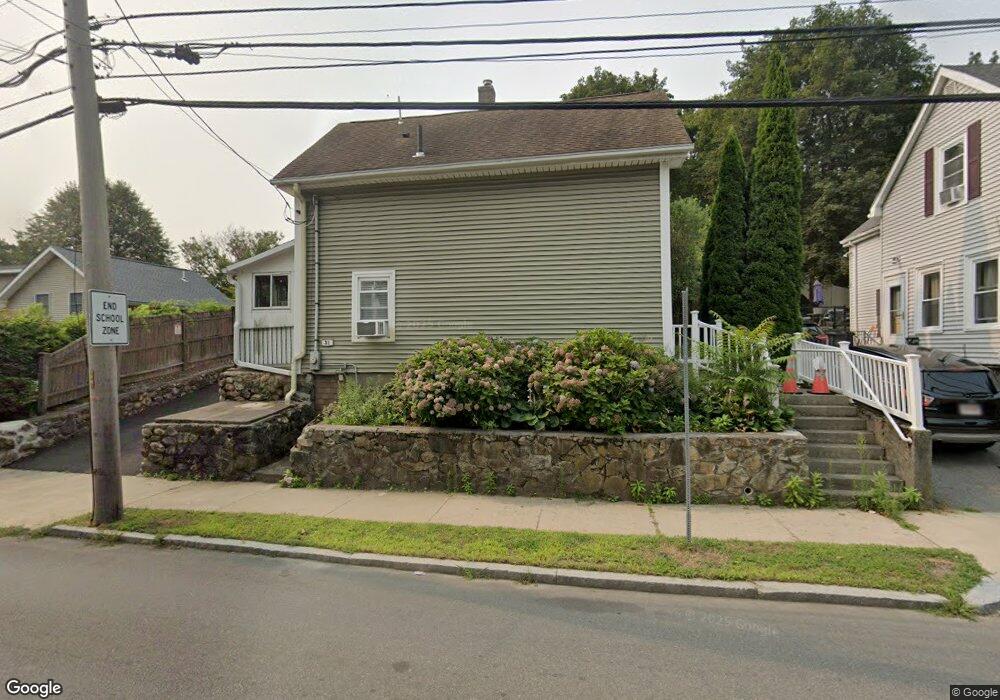
31 Summer St Stoneham, MA 02180
Haywardville NeighborhoodEstimated Value: $590,337 - $695,000
2
Beds
1
Bath
1,337
Sq Ft
$471/Sq Ft
Est. Value
About This Home
This home is located at 31 Summer St, Stoneham, MA 02180 and is currently estimated at $629,084, approximately $470 per square foot. 31 Summer St is a home located in Middlesex County with nearby schools including Stoneham High School, Greater Boston Academy, and St. Patrick Elementary School.
Ownership History
Date
Name
Owned For
Owner Type
Purchase Details
Closed on
Mar 13, 2015
Sold by
Sparks Janet M
Bought by
Sparks Gthomas J and Sparks Kevin T
Current Estimated Value
Purchase Details
Closed on
Dec 15, 2004
Sold by
Sparks Nelson B
Bought by
Sparks Janet M
Purchase Details
Closed on
Aug 14, 1964
Bought by
Sparks Janet M
Create a Home Valuation Report for This Property
The Home Valuation Report is an in-depth analysis detailing your home's value as well as a comparison with similar homes in the area
Home Values in the Area
Average Home Value in this Area
Purchase History
| Date | Buyer | Sale Price | Title Company |
|---|---|---|---|
| Sparks Gthomas J | -- | -- | |
| Sparks Janet M | -- | -- | |
| Sparks Janet M | -- | -- |
Source: Public Records
Mortgage History
| Date | Status | Borrower | Loan Amount |
|---|---|---|---|
| Previous Owner | Sparks Janet M | $20,000 |
Source: Public Records
Tax History
| Year | Tax Paid | Tax Assessment Tax Assessment Total Assessment is a certain percentage of the fair market value that is determined by local assessors to be the total taxable value of land and additions on the property. | Land | Improvement |
|---|---|---|---|---|
| 2025 | $5,416 | $529,400 | $333,100 | $196,300 |
| 2024 | $5,188 | $489,900 | $306,800 | $183,100 |
| 2023 | $4,841 | $436,100 | $280,500 | $155,600 |
| 2022 | $4,169 | $400,500 | $254,200 | $146,300 |
| 2021 | $3,927 | $362,900 | $219,200 | $143,700 |
| 2020 | $3,785 | $350,800 | $206,900 | $143,900 |
| 2019 | $10,068 | $329,700 | $196,100 | $133,600 |
| 2018 | $8,789 | $322,300 | $189,600 | $132,700 |
| 2017 | $8,071 | $278,000 | $166,500 | $111,500 |
| 2016 | $3,207 | $252,500 | $166,500 | $86,000 |
| 2015 | $3,000 | $231,500 | $149,900 | $81,600 |
| 2014 | $3,091 | $229,100 | $133,200 | $95,900 |
Source: Public Records
Map
Nearby Homes
- 472 Main St Unit C
- 12 Benton St Unit 4
- 426 Main St Unit 205
- 7 Carol St
- 6 Everett St
- 588 Main St Unit 1A
- 39 Chestnut St Unit 2C
- 193 Park St
- 7 Pine St
- 2 Pine St Unit 3
- 159 Franklin St Unit E6
- 6-8 South St Unit 3
- 6-8 South St Unit 2
- 6-8 South St Unit 1
- 177 Franklin St Unit 2
- 21 Bellevue Ave
- 4 Stratton Dr Unit 308
- 100 Ledgewood Dr Unit 410
- 6 Mason Way Unit 63
- 6 Stratton Dr Unit 3303
Your Personal Tour Guide
Ask me questions while you tour the home.