31 Sylvan Rd High Bridge, NJ 08829
Estimated Value: $402,000 - $559,000
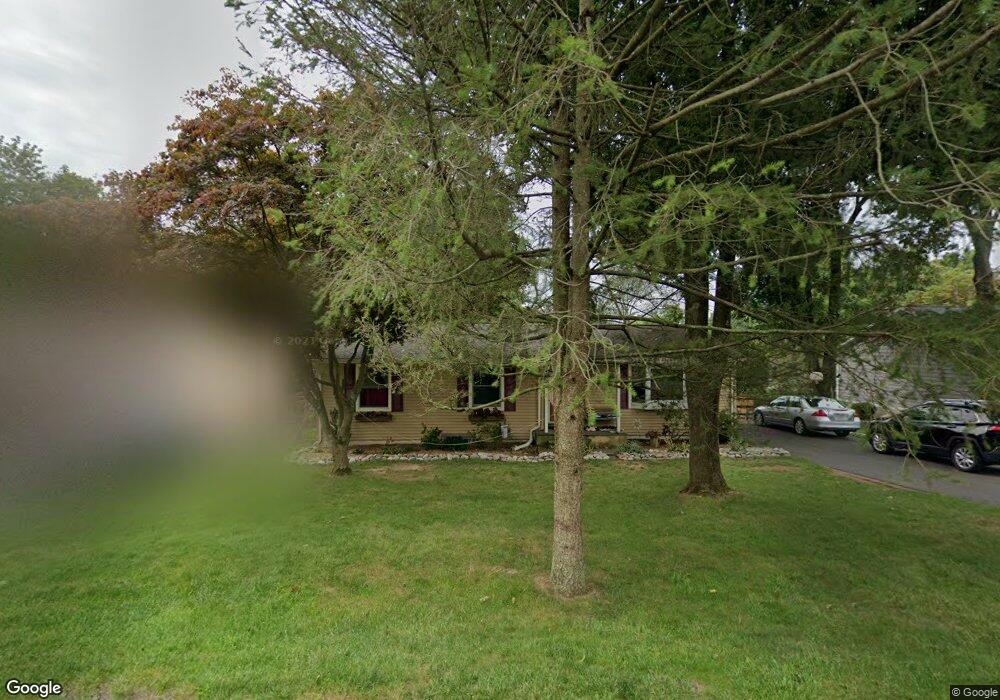
About This Home
This home is located at 31 Sylvan Rd, High Bridge, NJ 08829 and is currently estimated at $448,752, approximately $373 per square foot. 31 Sylvan Rd is a home located in Hunterdon County with nearby schools including High Bridge Elementary School, High Bridge Middle School, and Voorhees High School.
Ownership History
We collect this data history from publicly available records. To have your information removed, we recommend requesting removal directly through your county’s website.
Purchase Details
Home Financials for this Owner
Home Financials are based on the most recent Mortgage that was taken out on this home.Purchase Details
Purchase Details
Home Values in the Area
Average Home Value in this Area
Purchase History
We collect this data history from publicly available records. To have your information removed, we recommend requesting removal directly through your county’s website.
| Date | Buyer | Sale Price | Title Company |
|---|---|---|---|
| $170,000 | -- | ||
| $144,000 | -- | ||
| $162,000 | -- |
Mortgage History
We collect this data history from publicly available records. To have your information removed, we recommend requesting removal directly through your county’s website.
| Date | Status | Borrower | Loan Amount |
|---|---|---|---|
| Open | $136,000 |
Tax History
We collect this data history from publicly available records. To have your information removed, we recommend requesting removal directly through your county’s website.
| Year | Tax Paid | Tax Assessment Tax Assessment Total Assessment is a certain percentage of the fair market value that is determined by local assessors to be the total taxable value of land and additions on the property. | Land | Improvement |
|---|---|---|---|---|
| 2025 | $12,054 | $340,000 | $181,800 | $158,200 |
| 2024 | $10,834 | $369,300 | $143,300 | $226,000 |
| 2023 | $10,834 | $274,000 | $107,600 | $166,400 |
| 2022 | $9,535 | $224,100 | $94,900 | $129,200 |
| 2021 | $9,336 | $224,400 | $94,900 | $129,500 |
| 2020 | $9,233 | $225,200 | $94,900 | $130,300 |
| 2019 | $9,336 | $226,000 | $94,900 | $131,100 |
| 2018 | $8,885 | $224,200 | $92,300 | $131,900 |
| 2017 | $9,134 | $237,000 | $101,800 | $135,200 |
| 2016 | $9,027 | $237,000 | $101,800 | $135,200 |
| 2015 | $8,783 | $237,000 | $101,800 | $135,200 |
| 2014 | $8,384 | $244,500 | $137,600 | $106,900 |
Map
- 76 Valley View Rd
- 0 Beavers St
- 111 W Main St
- 34 Beavers St
- 7 Central Ave Unit 7&9
- 27 Central Ave
- 162 Cregar Rd
- 77 Main St
- 20 Woodland Terrace
- 13 Highview Dr
- 2 Elm Dr
- 18 Church St Unit 20
- 34 Taylor St
- 87 Crestview Dr
- 52 Thomas St
- 106 Cregar Rd
- 23 Crestview Dr
- 58 Dewey Ave
- 11 Colonial Ct
- 2 Driftway Dr
Ask me questions while you tour the home.