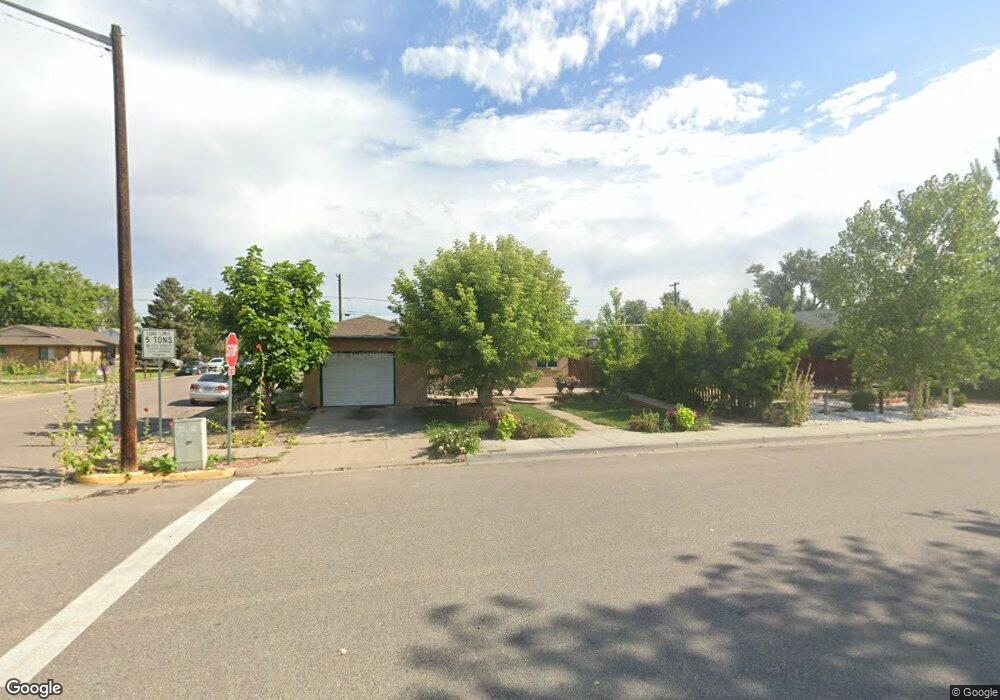
311 2nd St Fort Lupton, CO 80621
Estimated Value: $354,000 - $381,000
3
Beds
2
Baths
999
Sq Ft
$366/Sq Ft
Est. Value
About This Home
This home is located at 311 2nd St, Fort Lupton, CO 80621 and is currently estimated at $366,004, approximately $366 per square foot. 311 2nd St is a home located in Weld County with nearby schools including Leo William Butler Elementary School, Fort Lupton Middle School, and Fort Lupton High School.
Ownership History
Date
Name
Owned For
Owner Type
Purchase Details
Closed on
Mar 3, 2015
Sold by
Gasca Maribel and Delgado Leonel
Bought by
Gasca Maribel
Current Estimated Value
Purchase Details
Closed on
Jul 7, 2012
Sold by
Caudillo Jose and Carbajal Maribel
Bought by
Gasca Maribel and Delgado Lionel
Purchase Details
Closed on
May 4, 2001
Sold by
Patterson Judy
Bought by
Caudillo Jose and Carbajal Maribel
Home Financials for this Owner
Home Financials are based on the most recent Mortgage that was taken out on this home.
Original Mortgage
$148,646
Interest Rate
6.81%
Mortgage Type
FHA
Purchase Details
Closed on
Aug 23, 1994
Create a Home Valuation Report for This Property
The Home Valuation Report is an in-depth analysis detailing your home's value as well as a comparison with similar homes in the area
Home Values in the Area
Average Home Value in this Area
Purchase History
We collect this data history from publicly available records. To have your information removed, we recommend requesting removal directly through your county’s website.
| Date | Buyer | Sale Price | Title Company |
|---|---|---|---|
| Gasca Maribel | -- | None Available | |
| Gasca Maribel | -- | None Available | |
| Caudillo Jose | $151,000 | -- | |
| -- | -- | -- |
Source: Public Records
Mortgage History
We collect this data history from publicly available records. To have your information removed, we recommend requesting removal directly through your county’s website.
| Date | Status | Borrower | Loan Amount |
|---|---|---|---|
| Previous Owner | Caudillo Jose | $148,646 |
Source: Public Records
Tax History
| Year | Tax Paid | Tax Assessment Tax Assessment Total Assessment is a certain percentage of the fair market value that is determined by local assessors to be the total taxable value of land and additions on the property. | Land | Improvement |
|---|---|---|---|---|
| 2025 | $2,243 | $23,370 | $3,440 | $19,930 |
| 2024 | $2,243 | $23,370 | $3,440 | $19,930 |
| 2023 | $1,987 | $27,120 | $3,720 | $23,400 |
| 2022 | $1,891 | $20,930 | $1,910 | $19,020 |
| 2021 | $2,161 | $21,540 | $1,970 | $19,570 |
| 2020 | $1,702 | $19,060 | $1,910 | $17,150 |
| 2019 | $1,694 | $19,060 | $1,910 | $17,150 |
| 2018 | $1,320 | $14,810 | $1,800 | $13,010 |
| 2017 | $1,383 | $14,810 | $1,800 | $13,010 |
| 2016 | $1,008 | $11,400 | $1,190 | $10,210 |
| 2015 | $925 | $11,400 | $1,190 | $10,210 |
| 2014 | $719 | $8,300 | $1,190 | $7,110 |
Source: Public Records
Map
Nearby Homes
- 150 Fulton Ave
- 417 2nd St
- 200 2nd St
- 229 4th St
- 139 Park Ave
- 113 Park Ave
- 145 S Park Ave
- 252 1st St
- 203 S Park Ave
- 0 Lane Ct
- 125 S Grand Ave
- 148 7th St
- 302 S Mckinley Ave
- 111 7th St
- 0 8th St
- 247 S Grand Ave
- 500 S Denver Ave Unit 3A
- 500 S Denver Ave Unit 16B
- 500 S Denver Ave Unit 9-C
- 500 S Denver Ave Unit 7B
Your Personal Tour Guide
Ask me questions while you tour the home.