Estimated Value: $253,000 - $270,000
3
Beds
2
Baths
1,635
Sq Ft
$160/Sq Ft
Est. Value
About This Home
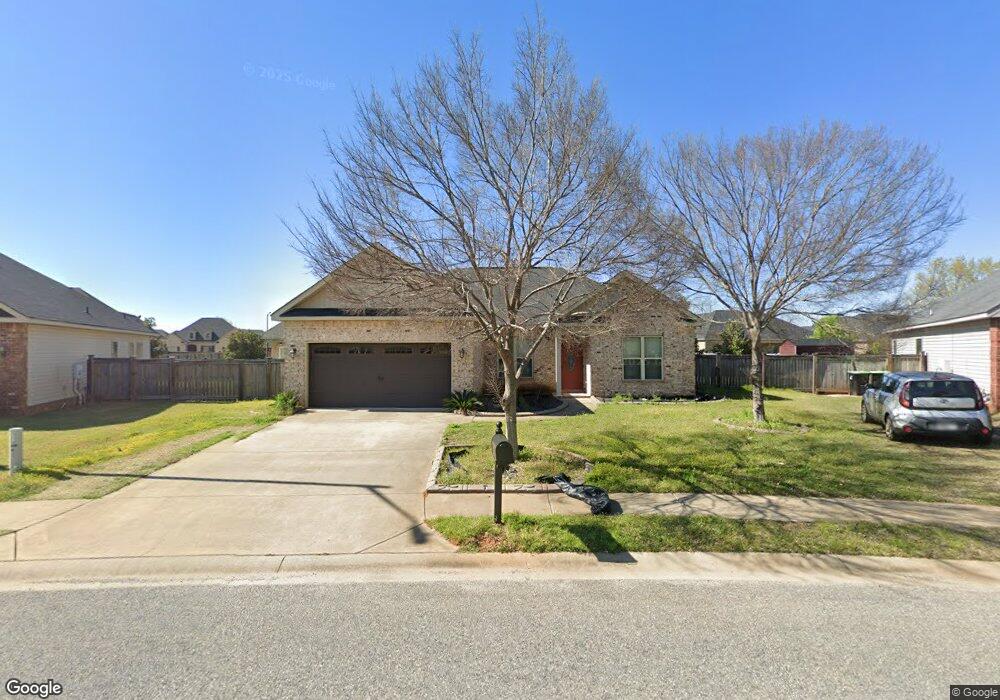
This home is located at 311 Amber Dr Unit 4, Byron, GA 31008 and is currently estimated at $261,211, approximately $159 per square foot. 311 Amber Dr Unit 4 is a home located in Peach County with nearby schools including Byron Elementary School, Byron Middle School, and Peach County High School.
Ownership History
Date
Name
Owned For
Owner Type
Purchase Details
Closed on
Sep 15, 2021
Sold by
Werner Emma Renee
Bought by
Gonzalez David
Current Estimated Value
Purchase Details
Closed on
Jun 30, 2014
Sold by
Caleb Properties Llc
Bought by
Werner Stefan
Home Financials for this Owner
Home Financials are based on the most recent Mortgage that was taken out on this home.
Original Mortgage
$153,061
Interest Rate
4.17%
Mortgage Type
New Conventional
Purchase Details
Closed on
Jul 8, 2013
Sold by
Alexis Investments Llc
Bought by
Caleb Properties Llc
Create a Home Valuation Report for This Property
The Home Valuation Report is an in-depth analysis detailing your home's value as well as a comparison with similar homes in the area
Home Values in the Area
Average Home Value in this Area
Purchase History
We collect this data history from publicly available records. To have your information removed, we recommend requesting removal directly through your county’s website.
| Date | Buyer | Sale Price | Title Company |
|---|---|---|---|
| Gonzalez David | $185,000 | -- | |
| Werner Stefan | $150,000 | -- | |
| Caleb Properties Llc | -- | -- |
Source: Public Records
Mortgage History
We collect this data history from publicly available records. To have your information removed, we recommend requesting removal directly through your county’s website.
| Date | Status | Borrower | Loan Amount |
|---|---|---|---|
| Previous Owner | Werner Stefan | $153,061 |
Source: Public Records
Tax History
| Year | Tax Paid | Tax Assessment Tax Assessment Total Assessment is a certain percentage of the fair market value that is determined by local assessors to be the total taxable value of land and additions on the property. | Land | Improvement |
|---|---|---|---|---|
| 2025 | $3,576 | $102,520 | $8,880 | $93,640 |
| 2024 | $3,290 | $92,200 | $8,720 | $83,480 |
| 2023 | $3,263 | $90,840 | $7,000 | $83,840 |
| 2022 | $1,992 | $80,404 | $7,000 | $73,404 |
| 2021 | $2,112 | $67,656 | $7,000 | $60,656 |
| 2020 | $1,937 | $62,032 | $7,000 | $55,032 |
| 2019 | $1,946 | $62,032 | $7,000 | $55,032 |
| 2018 | $1,956 | $62,032 | $7,000 | $55,032 |
| 2017 | $1,966 | $62,032 | $7,000 | $55,032 |
| 2016 | $1,957 | $62,032 | $7,000 | $55,032 |
| 2015 | $1,896 | $62,032 | $7,000 | $55,032 |
| 2014 | $154 | $4,880 | $4,880 | $0 |
Source: Public Records
Map
Nearby Homes
- 217 Caleb Way
- 212 Burr Dr
- 260 Caleb Way
- 502 Arrie Dr
- 102 Monroe Ct
- 129 Manchester Ln
- 107 Monroe Ct
- 105 Browning Point
- 508 Georgian Walk
- 504 Georgian Walk
- 604 Georgian Walk
- 502 Georgian Walk
- 706 Georgian Walk
- 100 Bulloch Ct
- 721 Georgian Walk
- 732 Georgian Walk
- 110 Bulloch Ct
- 112 Bulloch Ct
- 118 Covington Cove
- 302 Appling Way
Your Personal Tour Guide
Ask me questions while you tour the home.