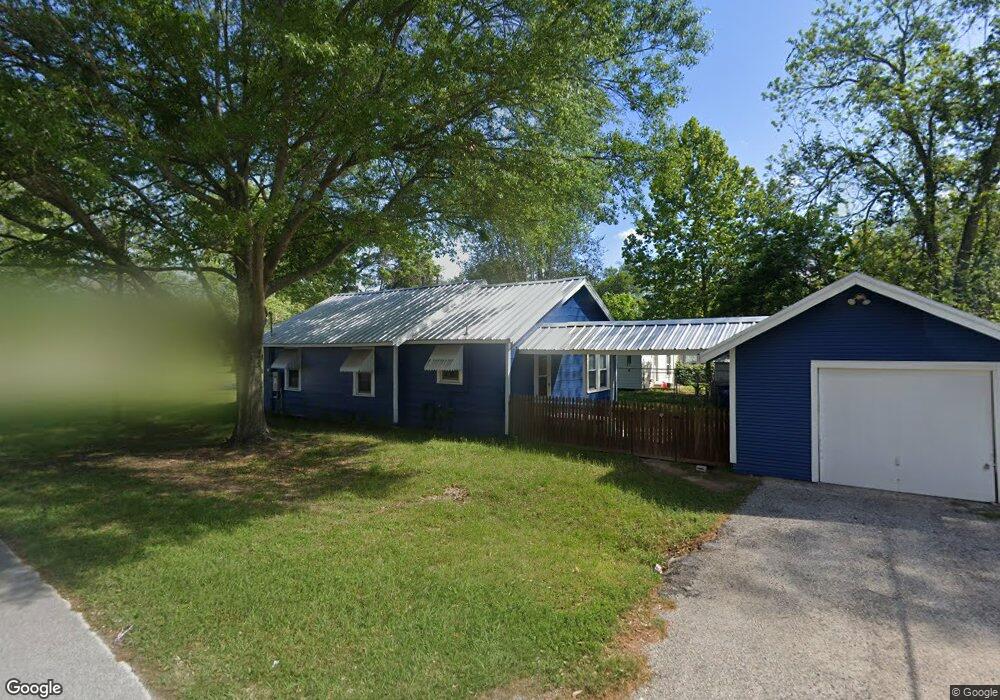
311 Oxford St Tomball, TX 77375
Estimated Value: $176,205 - $271,000
2
Beds
1
Bath
952
Sq Ft
$230/Sq Ft
Est. Value
About This Home
This home is located at 311 Oxford St, Tomball, TX 77375 and is currently estimated at $218,801, approximately $229 per square foot. 311 Oxford St is a home located in Harris County with nearby schools including Tomball Elementary School, Tomball Intermediate School, and Tomball Junior High School.
Ownership History
Date
Name
Owned For
Owner Type
Purchase Details
Closed on
May 18, 2006
Sold by
Conn Lynda Joyce and Conn Leland
Bought by
Conn Leland and Conn Lynda Joyce
Current Estimated Value
Home Financials for this Owner
Home Financials are based on the most recent Mortgage that was taken out on this home.
Original Mortgage
$67,750
Interest Rate
6.56%
Mortgage Type
Purchase Money Mortgage
Create a Home Valuation Report for This Property
The Home Valuation Report is an in-depth analysis detailing your home's value as well as a comparison with similar homes in the area
Home Values in the Area
Average Home Value in this Area
Purchase History
We collect this data history from publicly available records. To have your information removed, we recommend requesting removal directly through your county’s website.
| Date | Buyer | Sale Price | Title Company |
|---|---|---|---|
| Conn Leland | -- | None Available |
Source: Public Records
Mortgage History
We collect this data history from publicly available records. To have your information removed, we recommend requesting removal directly through your county’s website.
| Date | Status | Borrower | Loan Amount |
|---|---|---|---|
| Closed | Conn Leland | $67,750 |
Source: Public Records
Tax History
| Year | Tax Paid | Tax Assessment Tax Assessment Total Assessment is a certain percentage of the fair market value that is determined by local assessors to be the total taxable value of land and additions on the property. | Land | Improvement |
|---|---|---|---|---|
| 2025 | $3,229 | $167,088 | $96,750 | $70,338 |
| 2024 | $3,229 | $145,900 | $90,300 | $55,600 |
| 2023 | $3,229 | $147,738 | $77,400 | $70,338 |
| 2022 | $2,665 | $117,800 | $58,050 | $59,750 |
| 2021 | $2,118 | $89,293 | $41,925 | $47,368 |
| 2020 | $2,023 | $82,462 | $32,250 | $50,212 |
| 2019 | $1,735 | $68,783 | $25,800 | $42,983 |
| 2018 | $759 | $56,621 | $25,800 | $30,821 |
| 2017 | $1,427 | $56,621 | $25,800 | $30,821 |
| 2016 | $1,341 | $53,226 | $25,800 | $27,426 |
| 2015 | $1,087 | $53,226 | $25,800 | $27,426 |
| 2014 | $1,087 | $42,690 | $25,800 | $16,890 |
Source: Public Records
Map
Nearby Homes
- 0 Mason St
- 404 W Main St
- 18818 Cornelia Fields Ln
- 2235 Cold Stream Ln
- 18826 Cornelia Fields Ln
- 0 N Sycamore St
- 305 Peach St
- 508 Clarence St
- 410 N Peach St
- 535 Peach St
- 701 Malone St
- 221 Carrell St
- 712 Clarence St
- Lot 46 Moore St
- Lot 45 Moore St
- 0 Mcphail St Unit 80368221
- TBD Clayton St
- 409 Mcphail St
- 702 Clayton St
- lt 19 Mechanic Rd
Your Personal Tour Guide
Ask me questions while you tour the home.