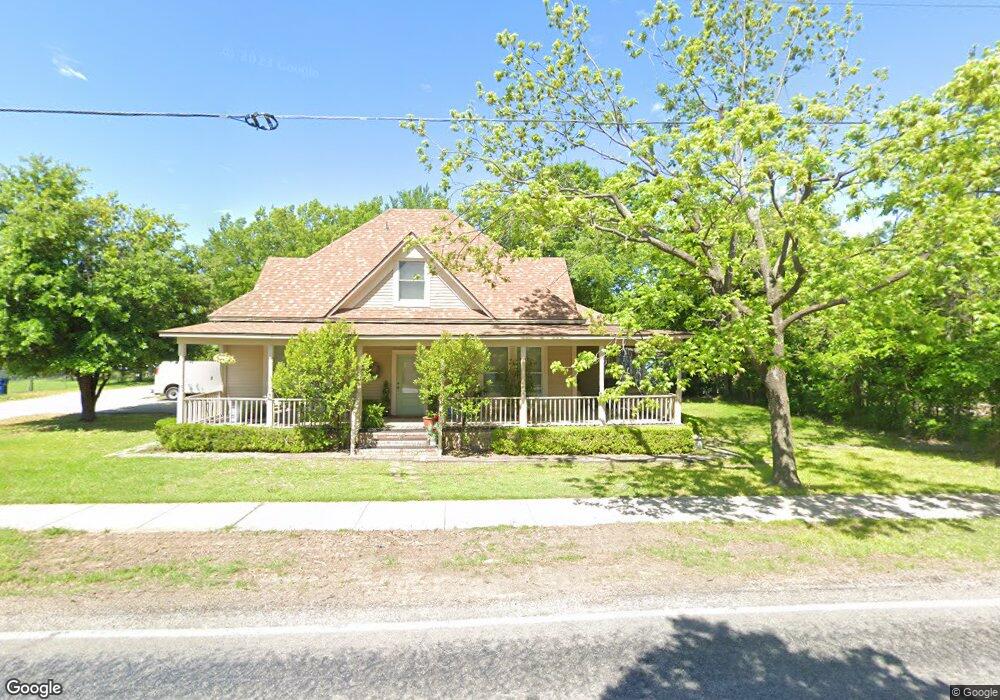
311 S 5th St Sanger, TX 76266
Estimated Value: $266,208 - $328,000
3
Beds
1
Bath
2,048
Sq Ft
$145/Sq Ft
Est. Value
About This Home
This home is located at 311 S 5th St, Sanger, TX 76266 and is currently estimated at $297,802, approximately $145 per square foot. 311 S 5th St is a home located in Denton County with nearby schools including Chisholm Trail Elementary School, Clear Creek Intermediate School, and Sanger Sixth Grade Campus.
Ownership History
Date
Name
Owned For
Owner Type
Purchase Details
Closed on
Aug 14, 2003
Sold by
James Michael
Bought by
Huckaby Jimmy N and Huckaby Susan E
Current Estimated Value
Home Financials for this Owner
Home Financials are based on the most recent Mortgage that was taken out on this home.
Original Mortgage
$129,510
Outstanding Balance
$54,958
Interest Rate
5.35%
Mortgage Type
Purchase Money Mortgage
Estimated Equity
$242,844
Create a Home Valuation Report for This Property
The Home Valuation Report is an in-depth analysis detailing your home's value as well as a comparison with similar homes in the area
Home Values in the Area
Average Home Value in this Area
Purchase History
We collect this data history from publicly available records. To have your information removed, we recommend requesting removal directly through your county’s website.
| Date | Buyer | Sale Price | Title Company |
|---|---|---|---|
| Huckaby Jimmy N | -- | -- | |
| Huckaby Jimmy N | -- | -- |
Source: Public Records
Mortgage History
We collect this data history from publicly available records. To have your information removed, we recommend requesting removal directly through your county’s website.
| Date | Status | Borrower | Loan Amount |
|---|---|---|---|
| Open | Huckaby Jimmy N | $129,510 | |
| Closed | Huckaby Jimmy N | $129,510 |
Source: Public Records
Tax History
| Year | Tax Paid | Tax Assessment Tax Assessment Total Assessment is a certain percentage of the fair market value that is determined by local assessors to be the total taxable value of land and additions on the property. | Land | Improvement |
|---|---|---|---|---|
| 2025 | $1,265 | $211,523 | $60,120 | $217,964 |
| 2024 | $3,886 | $192,294 | $0 | $0 |
| 2023 | $1,144 | $174,813 | $46,760 | $186,256 |
| 2022 | $3,524 | $158,921 | $36,740 | $233,428 |
| 2021 | $3,036 | $237,323 | $30,060 | $207,263 |
| 2020 | $2,906 | $131,340 | $30,060 | $171,402 |
| 2019 | $2,718 | $119,400 | $30,060 | $171,177 |
| 2018 | $2,485 | $108,545 | $30,060 | $143,353 |
| 2017 | $2,270 | $98,677 | $30,060 | $123,250 |
| 2016 | $1,066 | $89,706 | $16,700 | $73,006 |
| 2015 | $1,013 | $82,802 | $16,700 | $66,102 |
| 2013 | -- | $106,999 | $16,700 | $90,299 |
Source: Public Records
Map
Nearby Homes
Your Personal Tour Guide
Ask me questions while you tour the home.