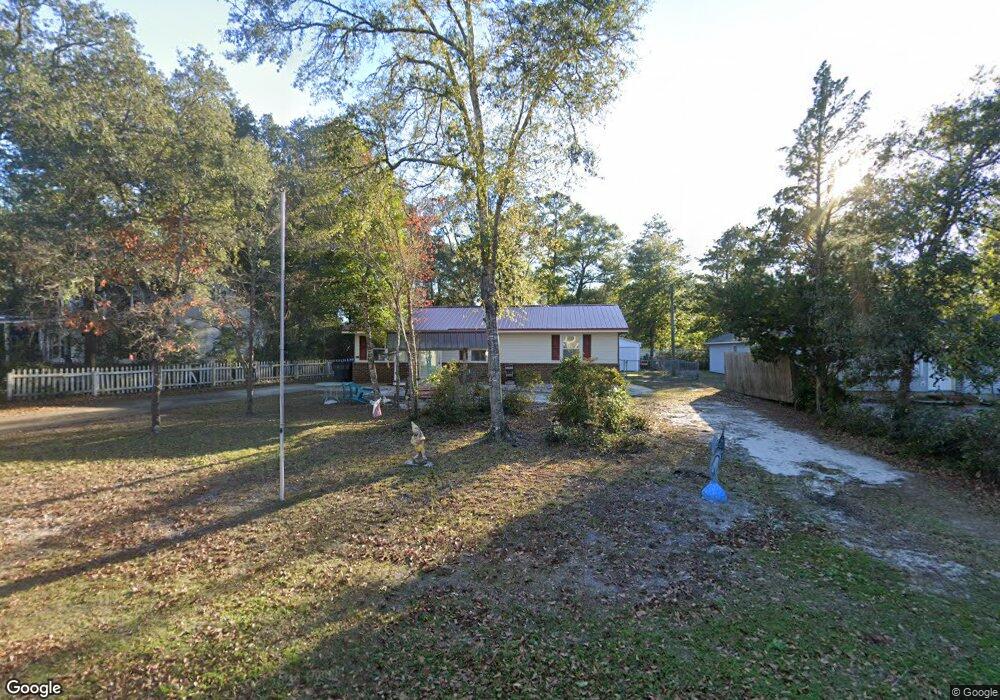
313 Herring Dr Southport, NC 28461
Estimated Value: $354,000 - $397,000
3
Beds
2
Baths
1,201
Sq Ft
$315/Sq Ft
Est. Value
About This Home
This home is located at 313 Herring Dr, Southport, NC 28461 and is currently estimated at $378,746, approximately $315 per square foot. 313 Herring Dr is a home located in Brunswick County with nearby schools including Southport Elementary School, South Brunswick Middle School, and South Brunswick High School.
Ownership History
Date
Name
Owned For
Owner Type
Purchase Details
Closed on
Mar 23, 2009
Sold by
Russ John J and Russ Mary Anne
Bought by
Lowery Steven R
Current Estimated Value
Home Financials for this Owner
Home Financials are based on the most recent Mortgage that was taken out on this home.
Original Mortgage
$125,400
Outstanding Balance
$79,949
Interest Rate
5.18%
Mortgage Type
Purchase Money Mortgage
Estimated Equity
$298,797
Create a Home Valuation Report for This Property
The Home Valuation Report is an in-depth analysis detailing your home's value as well as a comparison with similar homes in the area
Home Values in the Area
Average Home Value in this Area
Purchase History
| Date | Buyer | Sale Price | Title Company |
|---|---|---|---|
| Lowery Steven R | $124,000 | None Available |
Source: Public Records
Mortgage History
| Date | Status | Borrower | Loan Amount |
|---|---|---|---|
| Open | Lowery Steven R | $125,400 |
Source: Public Records
Tax History
| Year | Tax Paid | Tax Assessment Tax Assessment Total Assessment is a certain percentage of the fair market value that is determined by local assessors to be the total taxable value of land and additions on the property. | Land | Improvement |
|---|---|---|---|---|
| 2025 | -- | $285,210 | $122,000 | $163,210 |
| 2024 | $21 | $285,210 | $122,000 | $163,210 |
| 2023 | $1,732 | $285,210 | $122,000 | $163,210 |
| 2022 | $1,503 | $166,460 | $75,000 | $91,460 |
| 2021 | $1,503 | $166,460 | $75,000 | $91,460 |
| 2020 | $1,503 | $166,460 | $75,000 | $91,460 |
| 2019 | $1,503 | $77,640 | $75,000 | $2,640 |
| 2018 | $1,280 | $61,560 | $60,000 | $1,560 |
| 2017 | $1,267 | $61,560 | $60,000 | $1,560 |
| 2016 | $1,173 | $61,560 | $60,000 | $1,560 |
| 2015 | $1,173 | $139,220 | $60,000 | $79,220 |
| 2014 | $1,128 | $141,149 | $52,000 | $89,149 |
Source: Public Records
Map
Nearby Homes
- 304 E Leonard St
- 220 Willis Dr
- 417 E Leonard St
- 211 E Leonard St
- 610 N Fodale Ave
- 811 Memory Ln
- 271 Sand Dollar Ln Unit 26
- 614 N Atlantic Ave
- 263 Sand Dollar Ln Unit 27
- 716 N Atlantic Ave
- 2067 Rosin Dr
- 2067 Rosin Dr Unit 20
- 258 Sand Dollar Ln
- 2024 Oakton Dr
- 2024 Oakton Dr Unit 15
- 278 Sand Dollar Ln Unit 37
- 2031 Oakton Dr Unit 8
- 226 Sand Dollar Ln
- 2023 Oakton Dr
- 2023 Oakton Dr Unit 6
Your Personal Tour Guide
Ask me questions while you tour the home.