S
Seller's Agent in 2023
Stacy Johnson
Cochran & Co Realtors
(918) 630-2033
2 in this area
36 Total Sales

Estimated Value: $406,311 - $466,000
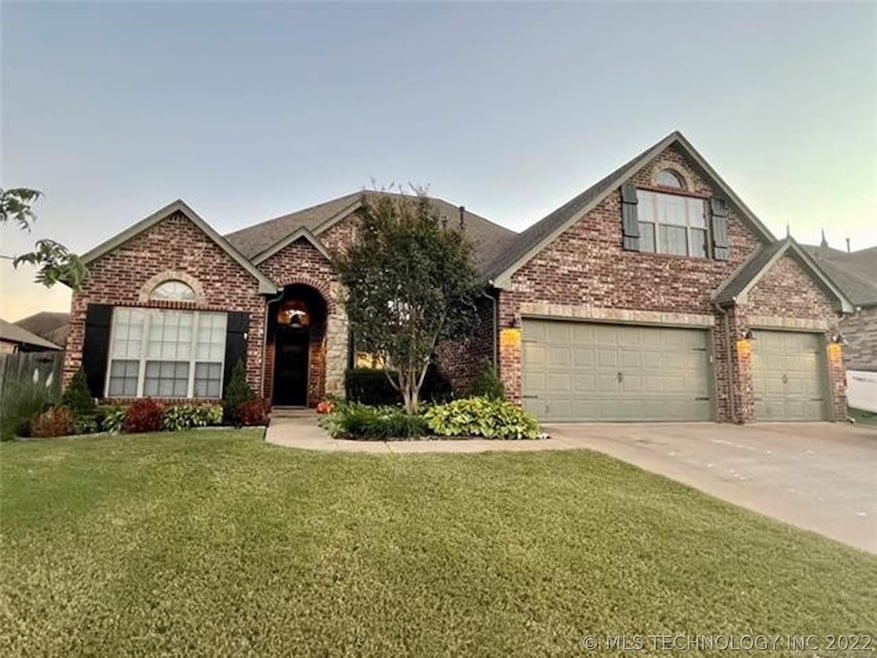
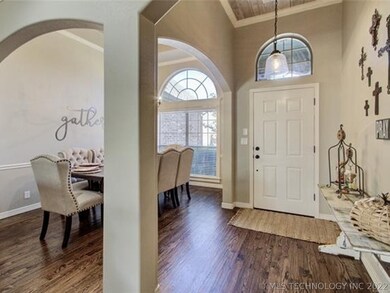
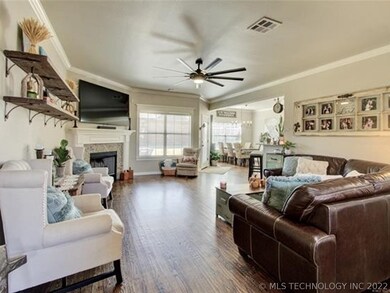
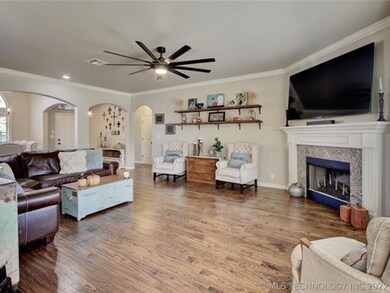
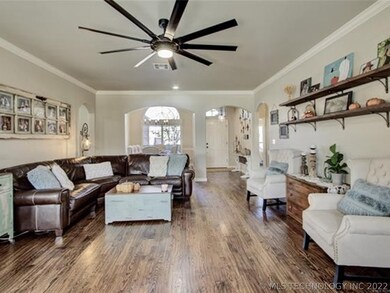
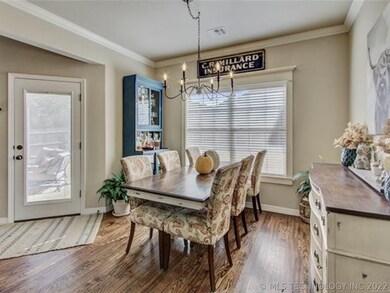
Stunning 4 bedroom home nestled in a desired & established neighborhood with a pond, park, pool and basketball court. Gorgeous hand scraped red oak hardwood floors throughout entry, living room, dining, kitchen, and master. Gourmet kitchen with a huge pantry for all your tasty treats. Fresh paint throughout wonderfully maintained home. Beautiful landscaping and a nice covered patio to enjoy a hot mug of coffee or a glass of sweet tea. You do not want to miss this incredible home! "Welcome Home".
Last Agent to Sell the Property
Cochran & Co Realtors License #139507 Listed on: 11/02/2022
We collect this data history from publicly available records. To have your information removed, we recommend requesting removal directly through your county’s website.
| Date | Buyer | Sale Price | Title Company |
|---|---|---|---|
| Morgans Nathan A | $395,000 | Apex Title | |
| Mixon Robert D | -- | None Available | |
| Mixon Robin E | $253,000 | Titan Title & Closing Llc | |
| Roper Steven D | $250,000 | None Available | |
| Dixon Justin W | $235,000 | None Available | |
| Stanford Homes Llc | $35,000 | -- |
We collect this data history from publicly available records. To have your information removed, we recommend requesting removal directly through your county’s website.
| Date | Status | Borrower | Loan Amount |
|---|---|---|---|
| Open | Morgans Nathan A | $409,220 | |
| Previous Owner | Mixon Robin E | $248,417 | |
| Previous Owner | Roper Steven D | $199,920 | |
| Previous Owner | Dixon Justin W | $215,201 |
| Date | Event | Price | List to Sale | Price per Sq Ft | Prior Sale |
|---|---|---|---|---|---|
| 01/18/2023 01/18/23 | Sold | $395,000 | -1.2% | $142 / Sq Ft | |
| 12/16/2022 12/16/22 | Pending | -- | -- | -- | |
| 11/16/2022 11/16/22 | Price Changed | $399,977 | -2.4% | $144 / Sq Ft | |
| 11/02/2022 11/02/22 | For Sale | $409,977 | +62.0% | $147 / Sq Ft | |
| 09/27/2013 09/27/13 | Sold | $253,000 | +1.2% | $91 / Sq Ft | View Prior Sale |
| 08/12/2013 08/12/13 | Pending | -- | -- | -- | |
| 08/12/2013 08/12/13 | For Sale | $250,000 | -- | $90 / Sq Ft |
| Year | Tax Paid | Tax Assessment Tax Assessment Total Assessment is a certain percentage of the fair market value that is determined by local assessors to be the total taxable value of land and additions on the property. | Land | Improvement |
|---|---|---|---|---|
| 2025 | $5,867 | $42,780 | $4,063 | $38,717 |
| 2024 | $4,507 | $43,130 | $4,158 | $38,972 |
| 2023 | $4,507 | $32,216 | $3,345 | $28,871 |
| 2022 | $4,311 | $30,683 | $3,945 | $26,738 |
| 2021 | $3,838 | $29,222 | $3,757 | $25,465 |
| 2020 | $3,678 | $27,830 | $3,850 | $23,980 |
| 2019 | $3,692 | $27,830 | $3,850 | $23,980 |
| 2018 | $3,658 | $27,830 | $3,850 | $23,980 |
| 2017 | $3,634 | $27,830 | $3,850 | $23,980 |
| 2016 | $3,590 | $27,830 | $3,850 | $23,980 |
| 2015 | $3,434 | $27,830 | $3,850 | $23,980 |
| 2014 | $3,428 | $27,830 | $3,850 | $23,980 |
S
Seller's Agent in 2023
Stacy Johnson
Cochran & Co Realtors
(918) 630-2033
2 in this area
36 Total Sales

Buyer's Agent in 2023
Amber Davis
Keller Williams Advantage
(918) 764-5277
36 in this area
278 Total Sales
K
Seller's Agent in 2013
Kim Klein
McGraw, REALTORS
(918) 724-5522
1 in this area
41 Total Sales
Source: MLS Technology
MLS Number: 2238099
APN: 57955-73-17-67520
Disclaimer: Certain information contained herein is derived from information provided by parties other than Homes.com. All information provided is deemed reliable, but is not guaranteed to be accurate and should be independently verified.
![]() IDX information is provided exclusively for personal, non-commercial use, and may not be used for any purpose other than to identify prospective properties consumers may be interested in purchasing.
IDX information is provided exclusively for personal, non-commercial use, and may not be used for any purpose other than to identify prospective properties consumers may be interested in purchasing.
Information is deemed reliable but not guaranteed.
Ask me questions while you tour the home.