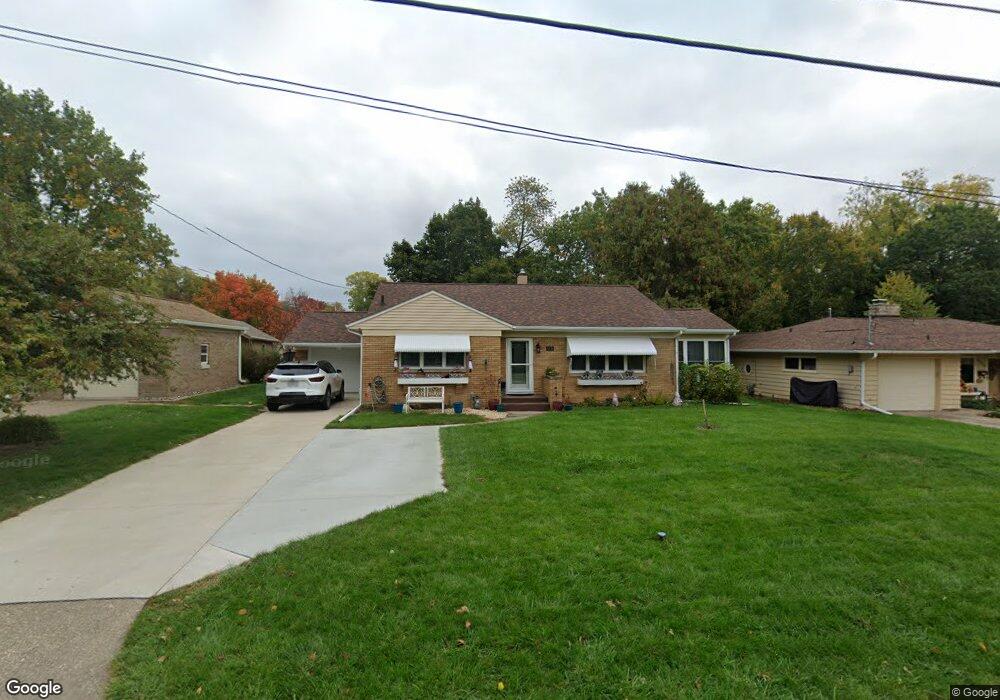
3136 14th St Moline, IL 61265
Prospect Park NeighborhoodEstimated Value: $159,000 - $191,000
2
Beds
2
Baths
1,316
Sq Ft
$131/Sq Ft
Est. Value
About This Home
This home is located at 3136 14th St, Moline, IL 61265 and is currently estimated at $172,988, approximately $131 per square foot. 3136 14th St is a home located in Rock Island County with nearby schools including Hamilton Elementary School, John Deere Middle School, and Moline Sr High School.
Ownership History
Date
Name
Owned For
Owner Type
Purchase Details
Closed on
Aug 13, 2020
Sold by
Wieck Michael D and Wieck Sharon K
Bought by
Thompson Jennifier B
Current Estimated Value
Home Financials for this Owner
Home Financials are based on the most recent Mortgage that was taken out on this home.
Original Mortgage
$74,900
Outstanding Balance
$64,845
Interest Rate
2.38%
Mortgage Type
New Conventional
Estimated Equity
$108,143
Create a Home Valuation Report for This Property
The Home Valuation Report is an in-depth analysis detailing your home's value as well as a comparison with similar homes in the area
Home Values in the Area
Average Home Value in this Area
Purchase History
| Date | Buyer | Sale Price | Title Company |
|---|---|---|---|
| Thompson Jennifier B | $129,900 | Midwest Community Title |
Source: Public Records
Mortgage History
| Date | Status | Borrower | Loan Amount |
|---|---|---|---|
| Open | Thompson Jennifier B | $74,900 |
Source: Public Records
Tax History
| Year | Tax Paid | Tax Assessment Tax Assessment Total Assessment is a certain percentage of the fair market value that is determined by local assessors to be the total taxable value of land and additions on the property. | Land | Improvement |
|---|---|---|---|---|
| 2024 | $3,726 | $48,230 | $11,296 | $36,934 |
| 2023 | $3,726 | $46,109 | $10,799 | $35,310 |
| 2022 | $4,427 | $48,656 | $10,799 | $37,857 |
| 2021 | $4,412 | $46,472 | $10,314 | $36,158 |
| 2020 | $4,434 | $46,194 | $10,252 | $35,942 |
| 2019 | $1,634 | $45,112 | $10,012 | $35,100 |
| 2018 | $3,207 | $44,581 | $9,893 | $34,688 |
| 2017 | $3,115 | $43,665 | $9,690 | $33,975 |
| 2016 | $2,426 | $42,935 | $9,528 | $33,407 |
| 2015 | $2,424 | $42,052 | $9,332 | $32,720 |
| 2014 | $783 | $42,043 | $9,330 | $32,713 |
| 2013 | $783 | $42,043 | $9,330 | $32,713 |
Source: Public Records
Map
Nearby Homes
- 3103 15th Street A
- 3104 15th St A St
- 1431 29th Ave
- 1577 31st Ave
- 2800 15th St
- 3305 11th St
- 2709 16th St
- 1511 36th Ave
- 3332 16th St
- 3808 15th Street B
- 1616 25th Ave
- 3820 15th St
- 2710 8th Street Ct
- 3818 15th Street C
- 2311 12th St
- 2121 15th Street A
- 2320 18th Street A
- 722 24th Avenue Ct
- 2308 18th Ave
- 3117 4th St Unit 3117
- 3220 14th St
- 3132 14th St
- 3128 14th St
- 3230 14th St
- 3207 14th St
- 3135 14th St
- 3113 15th St Unit C
- 3125 15th St Unit C
- 3124 14th St
- 3219 14th St
- 3041 14th St
- 3118 14th St
- 3221 15th St
- 3203 15th St Unit C
- 3210 15th St Unit C
- 3205 15th St Unit A
- 3207 15th St Unit A
- 3202 15th St Unit A
- 3220 15th St Unit C
- 3210 15th St Unit A
Your Personal Tour Guide
Ask me questions while you tour the home.