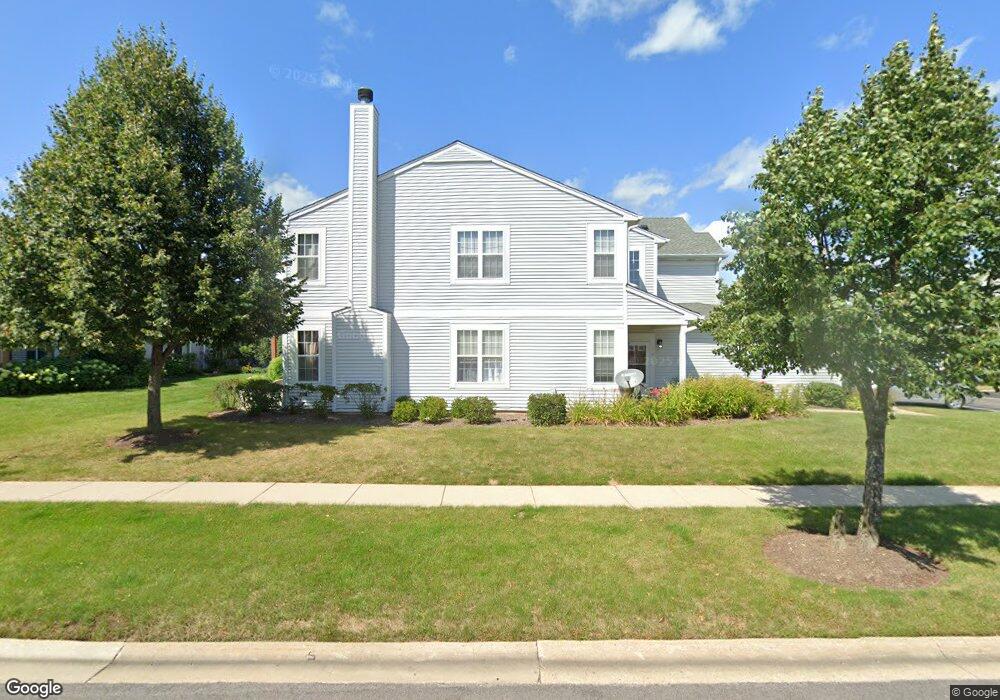
3139 Falling Waters Ln Lindenhurst, IL 60046
Estimated Value: $239,000 - $261,000
2
Beds
3
Baths
1,412
Sq Ft
$175/Sq Ft
Est. Value
About This Home
This home is located at 3139 Falling Waters Ln, Lindenhurst, IL 60046 and is currently estimated at $246,867, approximately $174 per square foot. 3139 Falling Waters Ln is a home located in Lake County with nearby schools including Millburn Elementary School, Millburn Middle School, and Grayslake North High School.
Ownership History
Date
Name
Owned For
Owner Type
Purchase Details
Closed on
Apr 11, 2019
Sold by
Hurley Patricia
Bought by
Cameron Rita
Current Estimated Value
Home Financials for this Owner
Home Financials are based on the most recent Mortgage that was taken out on this home.
Original Mortgage
$141,882
Outstanding Balance
$122,075
Interest Rate
3.99%
Mortgage Type
FHA
Estimated Equity
$124,792
Purchase Details
Closed on
Jan 6, 2009
Sold by
Jerome Sharon L
Bought by
Hurley Patricia
Purchase Details
Closed on
Apr 12, 2007
Sold by
Jerome Sharon L
Bought by
Jerome Sharon L and Sharon L Jerome Trust
Purchase Details
Closed on
Dec 22, 1999
Sold by
Pinnacle Corp
Bought by
Jerome Sharon L
Home Financials for this Owner
Home Financials are based on the most recent Mortgage that was taken out on this home.
Original Mortgage
$116,950
Interest Rate
7.89%
Create a Home Valuation Report for This Property
The Home Valuation Report is an in-depth analysis detailing your home's value as well as a comparison with similar homes in the area
Home Values in the Area
Average Home Value in this Area
Purchase History
We collect this data history from publicly available records. To have your information removed, we recommend requesting removal directly through your county’s website.
| Date | Buyer | Sale Price | Title Company |
|---|---|---|---|
| Cameron Rita | $144,500 | Chicago Title | |
| Hurley Patricia | $156,000 | None Available | |
| Jerome Sharon L | -- | None Available | |
| Jerome Sharon L | $121,500 | Chicago Title Insurance Co |
Source: Public Records
Mortgage History
We collect this data history from publicly available records. To have your information removed, we recommend requesting removal directly through your county’s website.
| Date | Status | Borrower | Loan Amount |
|---|---|---|---|
| Open | Cameron Rita | $141,882 | |
| Previous Owner | Jerome Sharon L | $116,950 |
Source: Public Records
Tax History
| Year | Tax Paid | Tax Assessment Tax Assessment Total Assessment is a certain percentage of the fair market value that is determined by local assessors to be the total taxable value of land and additions on the property. | Land | Improvement |
|---|---|---|---|---|
| 2025 | $6,050 | $66,320 | $10,315 | $56,005 |
| 2024 | $5,454 | $61,825 | $9,616 | $52,209 |
| 2023 | $5,427 | $54,625 | $8,496 | $46,129 |
| 2022 | $5,427 | $44,823 | $5,877 | $38,946 |
| 2021 | $5,259 | $41,637 | $5,459 | $36,178 |
| 2020 | $5,247 | $40,303 | $5,284 | $35,019 |
| 2019 | $5,002 | $38,734 | $5,078 | $33,656 |
| 2018 | $3,863 | $32,289 | $5,678 | $26,611 |
| 2017 | $3,770 | $31,428 | $5,527 | $25,901 |
| 2016 | $3,752 | $30,155 | $5,303 | $24,852 |
| 2015 | $3,578 | $28,164 | $4,953 | $23,211 |
| 2014 | $3,978 | $32,228 | $4,926 | $27,302 |
| 2012 | $4,587 | $32,384 | $4,950 | $27,434 |
Source: Public Records
Map
Nearby Homes
- 3142 Falling Waters Ln
- 2904 Falling Waters Dr
- 3099 Falling Waters Ln
- 2912 Falling Waters Ln
- 2954 Falling Waters Ln Unit 162954
- 450 Rosewood Crossing
- 563 Willow Way
- 40 U S 45
- 2911 Briargate Dr
- 2895 Briargate Dr
- 224 Cross Creek Ln
- 543 Sparrow Ct
- 274 Jasmine Cir
- 2823 Autumn Ridge Ct
- 2303 Neubauer Cir Unit 312
- 2103 Neubauer Cir
- 2906 Glenarye Dr
- 419 Deerpath Dr Unit 18
- 2804 Neubauer Cir Unit 154
- 18950 W Glenhurst Dr
- 3135 Falling Waters Ln
- 3133 Falling Waters Ln
- 3131 Falling Waters Ln
- 3127 Falling Waters Ln
- 3125 Falling Waters Ln
- 3127 Falling Waters Ln Unit 3127
- 3137 Falling Waters Ln
- 3139 Falling Waters Ln
- 3141 Falling Waters Ln
- 3143 Falling Waters Ln
- 3145 Falling Waters Ln
- 3141 Falling Waters Ln Unit 3141
- 2901 Falling Waters Dr
- 2901 Falling Waters Dr Unit 2901
- 3113 Falling Waters Ln
- 3115 Falling Waters Ln
- 3117 Falling Waters Ln
- 3119 Falling Waters Ln
- 3121 Falling Waters Ln
- 3123 Falling Waters Ln
Your Personal Tour Guide
Ask me questions while you tour the home.