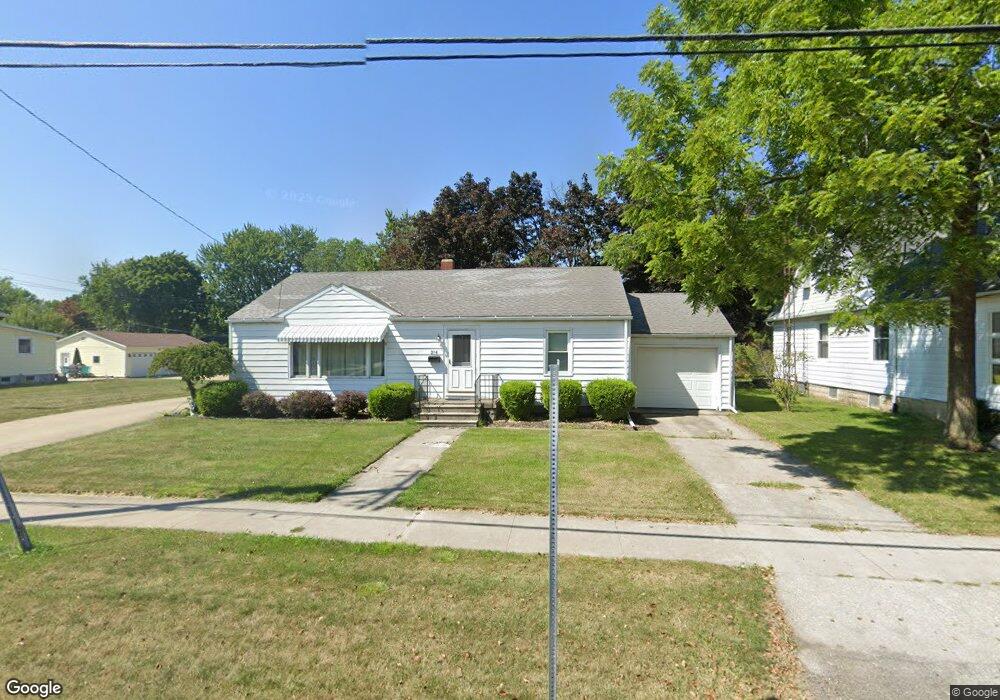
314 Stryker St Archbold, OH 43502
Estimated Value: $117,000 - $152,000
5
Beds
3
Baths
1,830
Sq Ft
$75/Sq Ft
Est. Value
About This Home
This home is located at 314 Stryker St, Archbold, OH 43502 and is currently estimated at $137,393, approximately $75 per square foot. 314 Stryker St is a home located in Fulton County with nearby schools including Archbold Elementary School, Archbold Middle School, and Archbold High School.
Ownership History
Date
Name
Owned For
Owner Type
Purchase Details
Closed on
Dec 31, 2014
Sold by
Short Joseph D
Bought by
J Point Investments Llc
Current Estimated Value
Purchase Details
Closed on
Jul 9, 2010
Sold by
Short Tara C
Bought by
Short Joseph D
Purchase Details
Closed on
Jan 1, 1990
Bought by
Aeschliman Ora C
Create a Home Valuation Report for This Property
The Home Valuation Report is an in-depth analysis detailing your home's value as well as a comparison with similar homes in the area
Home Values in the Area
Average Home Value in this Area
Purchase History
We collect this data history from publicly available records. To have your information removed, we recommend requesting removal directly through your county’s website.
| Date | Buyer | Sale Price | Title Company |
|---|---|---|---|
| J Point Investments Llc | -- | Attorney | |
| Short Joseph D | -- | Attorney | |
| Short Joseph D | -- | Attorney | |
| Aeschliman Ora C | -- | -- |
Source: Public Records
Tax History
| Year | Tax Paid | Tax Assessment Tax Assessment Total Assessment is a certain percentage of the fair market value that is determined by local assessors to be the total taxable value of land and additions on the property. | Land | Improvement |
|---|---|---|---|---|
| 2025 | $1,548 | $29,720 | $9,840 | $19,880 |
| 2024 | $1,548 | $29,720 | $9,840 | $19,880 |
| 2023 | $1,563 | $29,720 | $9,840 | $19,880 |
| 2022 | $1,233 | $24,750 | $8,190 | $16,560 |
| 2021 | $1,235 | $24,750 | $8,190 | $16,560 |
| 2020 | $1,230 | $24,750 | $8,190 | $16,560 |
| 2019 | $1,233 | $23,660 | $8,190 | $15,470 |
| 2018 | $1,117 | $23,660 | $8,190 | $15,470 |
| 2017 | $1,085 | $23,660 | $8,190 | $15,470 |
| 2016 | $1,107 | $22,260 | $8,190 | $14,070 |
| 2015 | $974 | $22,260 | $8,190 | $14,070 |
| 2014 | $973 | $22,260 | $8,190 | $14,070 |
| 2013 | $1,055 | $23,000 | $6,340 | $16,660 |
Source: Public Records
Map
Nearby Homes
- 404 Park St
- 205 Vine St
- 208 Vine St
- 909 Monterey Ct
- 916 Monterey Ct
- 808 West St
- 109 W Lugbill Rd
- 433 Primrose Ln
- 102 Monumental St
- 501 Quail Run
- V-526 Co Rd 25
- 22850 Burlington Gardens St
- 1444 County Road 20
- 24047 State Route 34
- 307 E Curtis St
- 303 E Curtis St
- 106 W Lynn St
- 21672 County Road J
- 18857 U S 20a
- 102 W Lynn St
- 314 Stryker St
- 312 Stryker St
- 318 Stryker St
- 315 Stryker St
- 311 Stryker St
- 315 W Holland St
- 310 Stryker St
- 313 W Holland St
- 309 Stryker St
- 309 Stryker St
- 317 W Holland St
- 317 W Holland St Unit AR958
- 320 Stryker St
- 307 Stryker St
- 319 W Holland St
- 319 Stryker St
- 322 Stryker St
- 0 Eicher St
- 2 Eicher St
- 323 W Holland St
Your Personal Tour Guide
Ask me questions while you tour the home.