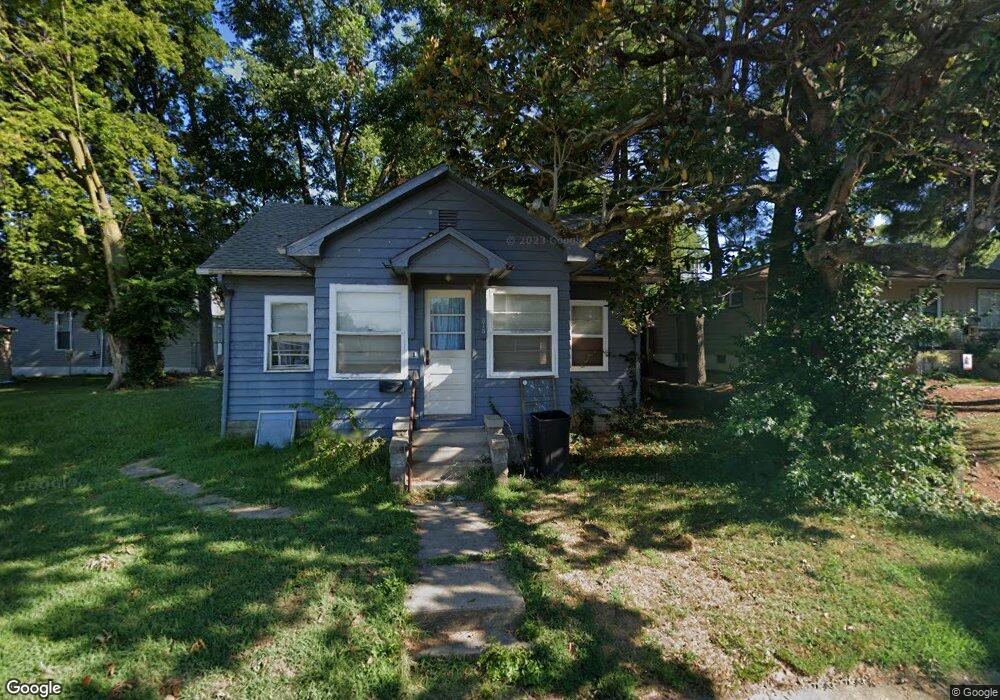
315 E 9th St Unit E Mount Vernon, IN 47620
Mount Vernon AreaEstimated Value: $51,000 - $87,000
About This Home
This home is located at 315 E 9th St Unit E, Mount Vernon, IN 47620 and is currently estimated at $68,298, approximately $101 per square foot. 315 E 9th St Unit E is a home located in Posey County with nearby schools including Mount Vernon Junior High School, Mount Vernon High School, and St. Matthew Elementary School.
Ownership History
We collect this data history from publicly available records. To have your information removed, we recommend requesting removal directly through your county’s website.
Purchase Details
Home Financials for this Owner
Home Financials are based on the most recent Mortgage that was taken out on this home.Home Values in the Area
Average Home Value in this Area
Purchase History
We collect this data history from publicly available records. To have your information removed, we recommend requesting removal directly through your county’s website.
| Date | Buyer | Sale Price | Title Company |
|---|---|---|---|
| -- | None Listed On Document |
Mortgage History
We collect this data history from publicly available records. To have your information removed, we recommend requesting removal directly through your county’s website.
| Date | Status | Borrower | Loan Amount |
|---|---|---|---|
| Open | $760,000 | ||
| Closed | $340,000 |
Tax History
We collect this data history from publicly available records. To have your information removed, we recommend requesting removal directly through your county’s website.
| Year | Tax Paid | Tax Assessment Tax Assessment Total Assessment is a certain percentage of the fair market value that is determined by local assessors to be the total taxable value of land and additions on the property. | Land | Improvement |
|---|---|---|---|---|
| 2025 | $1,002 | $50,100 | $6,000 | $44,100 |
| 2024 | $412 | $49,800 | $6,000 | $43,800 |
| 2023 | $760 | $38,000 | $6,000 | $32,000 |
| 2022 | $716 | $35,800 | $6,000 | $29,800 |
| 2021 | $652 | $32,600 | $6,000 | $26,600 |
| 2020 | $626 | $31,300 | $5,900 | $25,400 |
| 2019 | $612 | $30,600 | $5,900 | $24,700 |
| 2018 | $586 | $29,300 | $5,900 | $23,400 |
| 2017 | $582 | $29,100 | $5,900 | $23,200 |
| 2016 | $1,174 | $29,700 | $5,900 | $23,800 |
| 2014 | $576 | $28,800 | $5,900 | $22,900 |
| 2013 | $576 | $32,400 | $8,300 | $24,100 |
Map
- 1127 N Canal St
- 121 W 9th St
- 203 W Tenth St
- 1305 N Canal St
- 1209 Dereham Dr
- 221 W 8th St
- 703 College Ave
- 531 E 5th St
- 409 E 2nd St
- 1904 Jefferson St Unit 423
- 1900 Jefferson St Unit 414
- 526 E 2nd St
- 402 E Water St
- 1000 E 3rd St
- 505 W 2nd St
- 521 W 2nd St
- 1212 Cardinal Dr
- 1128 E 2nd St
- 408 Kennedy Dr
- 1901 & 1905 Cherry Ln
- 324 E 10th St
- 320 E 10th St
- 328 E 10th St
- 926 Mulberry St
- 918 Mulberry St
- 930 Mulberry St
- 327 E 9th St
- 912 Mulberry St
- 924 Mulberry St
- 321 E 9th St Unit E
- 910 Mulberry St
- 321 E 10th St
- 325 E 10th St
- 325 E 10th St
- 317 E 10th St
- 920 Locust St
- 1002 Mulberry St
- 912 Locust St
- 902 Locust St
- 900 Mulberry St
Ask me questions while you tour the home.