315 E Main St Lowell, IN 46356
Cedar Creek NeighborhoodEstimated Value: $152,000 - $246,796
About This Home
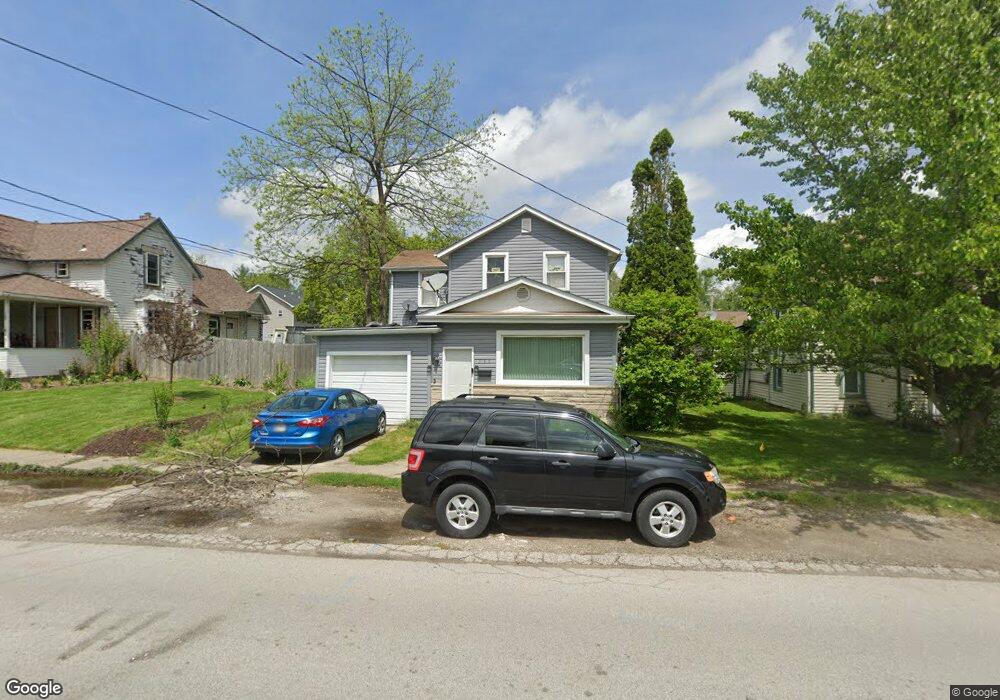
This home is located at 315 E Main St, Lowell, IN 46356 and is currently estimated at $199,449, approximately $124 per square foot. 315 E Main St is a home located in Lake County with nearby schools including Lowell Middle School and Lowell Senior High School.
Ownership History
We collect this data history from publicly available records. To have your information removed, we recommend requesting removal directly through your county’s website.
Purchase Details
Home Financials for this Owner
Home Financials are based on the most recent Mortgage that was taken out on this home.Purchase Details
Home Financials for this Owner
Home Financials are based on the most recent Mortgage that was taken out on this home.Home Values in the Area
Average Home Value in this Area
Purchase History
We collect this data history from publicly available records. To have your information removed, we recommend requesting removal directly through your county’s website.
| Date | Buyer | Sale Price | Title Company |
|---|---|---|---|
| -- | Near North Title | ||
| -- | Near North Title |
Mortgage History
We collect this data history from publicly available records. To have your information removed, we recommend requesting removal directly through your county’s website.
| Date | Status | Borrower | Loan Amount |
|---|---|---|---|
| Open | $172,000 |
Tax History
We collect this data history from publicly available records. To have your information removed, we recommend requesting removal directly through your county’s website.
| Year | Tax Paid | Tax Assessment Tax Assessment Total Assessment is a certain percentage of the fair market value that is determined by local assessors to be the total taxable value of land and additions on the property. | Land | Improvement |
|---|---|---|---|---|
| 2025 | $1,935 | $212,200 | $19,100 | $193,100 |
| 2024 | $4,973 | $200,800 | $19,100 | $181,700 |
| 2023 | $1,778 | $187,600 | $19,100 | $168,500 |
| 2022 | $1,778 | $177,800 | $19,100 | $158,700 |
| 2021 | $1,324 | $141,300 | $14,900 | $126,400 |
| 2020 | $1,289 | $141,000 | $14,900 | $126,100 |
| 2019 | $1,317 | $132,900 | $14,900 | $118,000 |
| 2018 | $1,294 | $130,900 | $14,900 | $116,000 |
| 2017 | $1,301 | $125,000 | $12,700 | $112,300 |
| 2016 | $1,088 | $119,500 | $12,700 | $106,800 |
| 2014 | $1,123 | $121,700 | $12,700 | $109,000 |
| 2013 | $1,164 | $120,900 | $12,700 | $108,200 |
Map
- 128 Halsted St
- 227 Mill St
- 134 N Fremont St
- 427 E Commercial Ave
- 230 Grant St
- 799 Burnham St
- 244 Burnham St
- 5012 Stephen Ln
- 5088 Stephen Ln
- 5062 Stephen Ln
- 345 Castle St
- 224 Washington St
- 322 Burnham St
- 111 Prairie St
- 1120 Lincoln St
- 238 N Nichols St
- 115 N Nichols St
- 18388 Alexander Ave
- 279 W Oakley Ave
- 1057 Woodland Ct
Ask me questions while you tour the home.