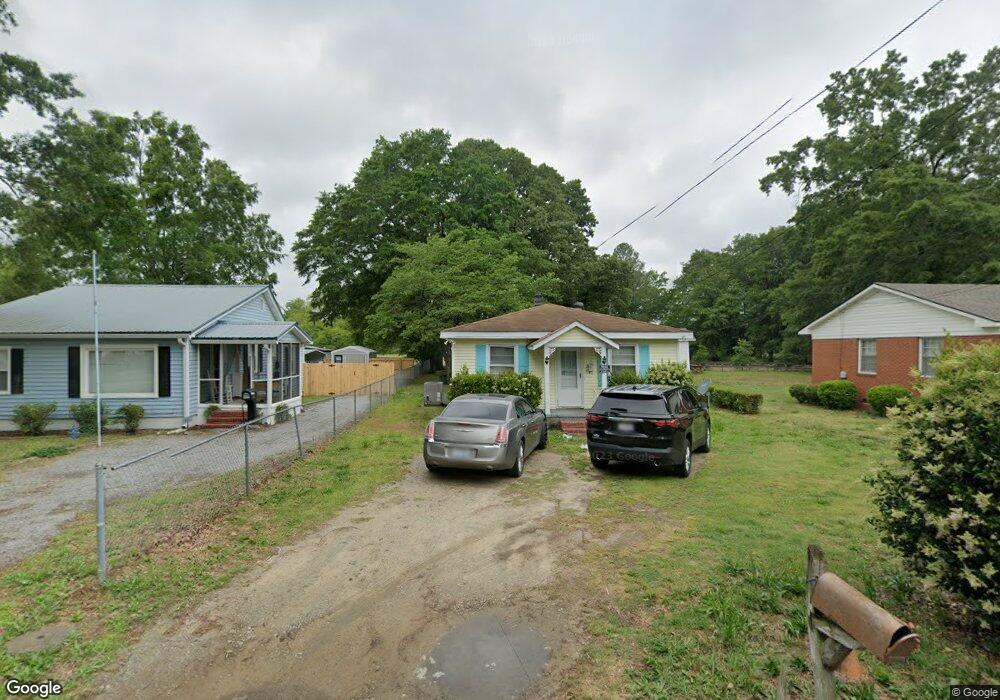
315 N Elm St Maxton, NC 28364
Estimated Value: $73,000 - $189,000
3
Beds
1
Bath
1,225
Sq Ft
$98/Sq Ft
Est. Value
About This Home
This home is located at 315 N Elm St, Maxton, NC 28364 and is currently estimated at $120,360, approximately $98 per square foot. 315 N Elm St is a home located in Robeson County with nearby schools including Townsend Elementary, Parkton Elementary School, and Purnell Swett High School.
Ownership History
Date
Name
Owned For
Owner Type
Purchase Details
Closed on
Nov 15, 2019
Sold by
Smith Charles R and Smith Pamela
Bought by
Smith Charles R
Current Estimated Value
Purchase Details
Closed on
Sep 14, 2017
Sold by
Secretary Of Veterans Affairs
Bought by
Paul Davie Lee and Smith Ii Charles R
Purchase Details
Closed on
Jul 10, 2017
Sold by
Ingle Grady I
Bought by
Wells Fargo Bank Na
Purchase Details
Closed on
Jun 13, 2017
Sold by
Wells Fargo Bank Na
Bought by
Veterans Admin
Purchase Details
Closed on
Jan 1, 2001
Sold by
Morgan Wayland G
Bought by
Lewis Weldon W and Wf Lewis Bonnie B
Create a Home Valuation Report for This Property
The Home Valuation Report is an in-depth analysis detailing your home's value as well as a comparison with similar homes in the area
Home Values in the Area
Average Home Value in this Area
Purchase History
We collect this data history from publicly available records. To have your information removed, we recommend requesting removal directly through your county’s website.
| Date | Buyer | Sale Price | Title Company |
|---|---|---|---|
| Smith Charles R | -- | None Available | |
| Paul Davie Lee | -- | None Available | |
| Wells Fargo Bank Na | -- | None Available | |
| Veterans Admin | -- | None Available | |
| Lewis Weldon W | -- | -- |
Source: Public Records
Tax History
| Year | Tax Paid | Tax Assessment Tax Assessment Total Assessment is a certain percentage of the fair market value that is determined by local assessors to be the total taxable value of land and additions on the property. | Land | Improvement |
|---|---|---|---|---|
| 2025 | $696 | $82,100 | $13,200 | $68,900 |
| 2024 | $691 | $82,100 | $13,200 | $68,900 |
| 2023 | $520 | $67,500 | $12,000 | $55,500 |
| 2022 | $583 | $67,500 | $12,000 | $55,500 |
| 2021 | $583 | $67,500 | $12,000 | $55,500 |
| 2020 | $568 | $67,500 | $12,000 | $55,500 |
| 2018 | $580 | $50,600 | $0 | $50,600 |
| 2017 | $542 | $50,600 | $0 | $50,600 |
| 2016 | $542 | $50,600 | $0 | $50,600 |
| 2015 | $542 | $50,600 | $0 | $50,600 |
| 2014 | $542 | $50,600 | $0 | $50,600 |
Source: Public Records
Map
Nearby Homes
- 301 W Central St
- TBD St
- 109 S Austin St
- 304 S Patterson St
- Tbd N Carolina 71
- 701 McCaskill Ave
- 405 S Austin St
- 204 Lane St
- 303 Cemetery Rd
- 109 W Chestnut St
- 397 Johns Rd
- 12101 Cameron Way
- 567 Johns Rd
- 236 S Patterson St
- 515 N Carolina 71
- 4377 McGirt Rd
- 0 Maxton Pond Rd
- 0 Clark Rd Unit 760123
- 00 Clark Rd
- Lot 8 Fairley Rd
Your Personal Tour Guide
Ask me questions while you tour the home.