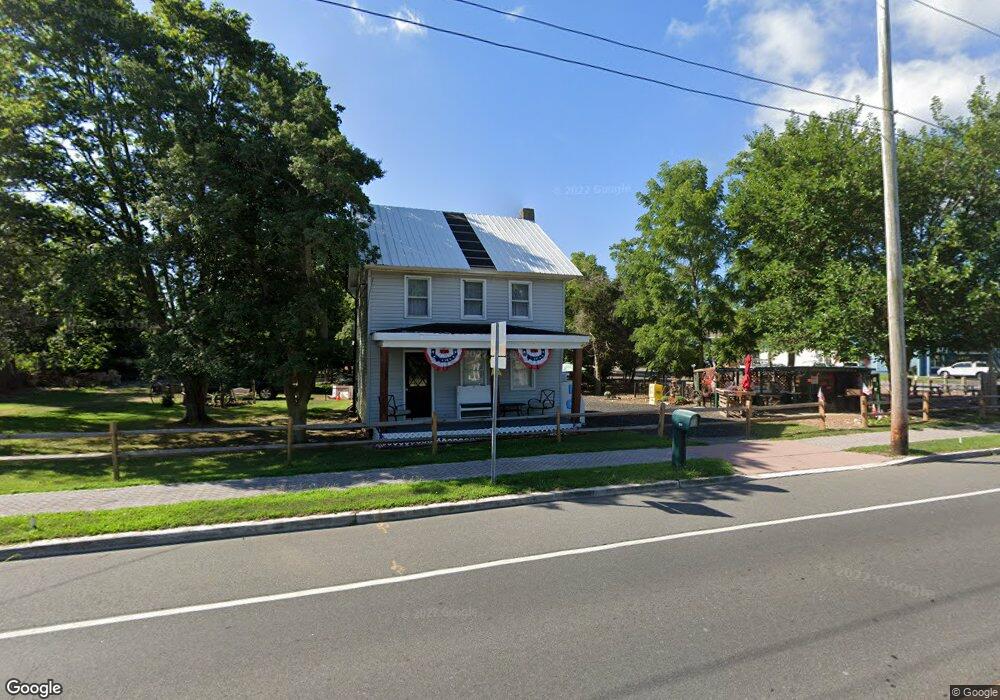
316 E Main St Tuckerton, NJ 08087
Estimated Value: $360,984 - $528,000
3
Beds
3
Baths
1,452
Sq Ft
$298/Sq Ft
Est. Value
About This Home
This home is located at 316 E Main St, Tuckerton, NJ 08087 and is currently estimated at $432,661, approximately $297 per square foot. 316 E Main St is a home located in Ocean County with nearby schools including Tuckerton Elementary School, Pinelands Regional Junior High School, and Pinelands Regional High School.
Ownership History
Date
Name
Owned For
Owner Type
Purchase Details
Closed on
Jun 22, 2020
Sold by
Caruso Thomas and Caruso Billie Jo
Bought by
Warner Carrie and Walker Daniel
Current Estimated Value
Home Financials for this Owner
Home Financials are based on the most recent Mortgage that was taken out on this home.
Original Mortgage
$189,000
Outstanding Balance
$97,310
Interest Rate
3.2%
Mortgage Type
Seller Take Back
Estimated Equity
$335,351
Purchase Details
Closed on
Dec 20, 2007
Sold by
Pritsch Catherine
Bought by
Caruso Thomas and Caruso Billie Jo
Purchase Details
Closed on
Feb 23, 1999
Sold by
Stransky Violet M and Stransky Oskar
Bought by
Pritsch Catherine
Home Financials for this Owner
Home Financials are based on the most recent Mortgage that was taken out on this home.
Original Mortgage
$50,000
Interest Rate
6.78%
Purchase Details
Closed on
Dec 9, 1997
Sold by
Stransky Violet M and Ryan Violet E
Bought by
Stransky Oskar and Stransky Violet M
Create a Home Valuation Report for This Property
The Home Valuation Report is an in-depth analysis detailing your home's value as well as a comparison with similar homes in the area
Home Values in the Area
Average Home Value in this Area
Purchase History
| Date | Buyer | Sale Price | Title Company |
|---|---|---|---|
| Warner Carrie | $199,000 | Surety Ttl Agcy Coastal Regi | |
| Caruso Thomas | $300,000 | Multiple | |
| Pritsch Catherine | $70,000 | -- | |
| Stransky Oskar | -- | -- |
Source: Public Records
Mortgage History
| Date | Status | Borrower | Loan Amount |
|---|---|---|---|
| Open | Warner Carrie | $189,000 | |
| Previous Owner | Pritsch Catherine | $50,000 |
Source: Public Records
Tax History
| Year | Tax Paid | Tax Assessment Tax Assessment Total Assessment is a certain percentage of the fair market value that is determined by local assessors to be the total taxable value of land and additions on the property. | Land | Improvement |
|---|---|---|---|---|
| 2025 | $5,903 | $184,400 | $115,100 | $69,300 |
| 2024 | $4,109 | $145,600 | $115,100 | $30,500 |
| 2023 | $3,847 | $145,600 | $115,100 | $30,500 |
| 2022 | $3,847 | $145,600 | $115,100 | $30,500 |
| 2021 | $3,778 | $145,600 | $115,100 | $30,500 |
| 2020 | $3,815 | $145,600 | $115,100 | $30,500 |
| 2019 | $6,347 | $242,700 | $172,700 | $70,000 |
| 2018 | $5,421 | $212,500 | $159,200 | $53,300 |
| 2017 | $5,168 | $212,500 | $159,200 | $53,300 |
| 2016 | $4,898 | $212,500 | $159,200 | $53,300 |
| 2015 | $4,839 | $212,500 | $159,200 | $53,300 |
| 2014 | $4,809 | $212,500 | $159,200 | $53,300 |
Source: Public Records
Map
Nearby Homes
- 250 Tip Seaman Dr
- 135 E Main St
- 147 Locust St
- 130 Otis Ave
- 233 S Green St
- 0 E Main St Unit NJOC2025964
- 0 E Main St Unit 22413983
- 230 S Green St
- 112 1st Ave
- 68 Edgewater Dr
- 367 S South Green St
- 367 S Green St
- 0 Birchwood Dr
- 110 4th Ave
- 120 Cox Ave
- 22 Nugentown Rd
- 434 Golf View Dr
- 220B Center St
- 525 E Main St Unit D3
- 213 Western Ave
Your Personal Tour Guide
Ask me questions while you tour the home.