317 Ferry St Marshfield, MA 02050
Estimated Value: $884,250 - $963,000
About This Home
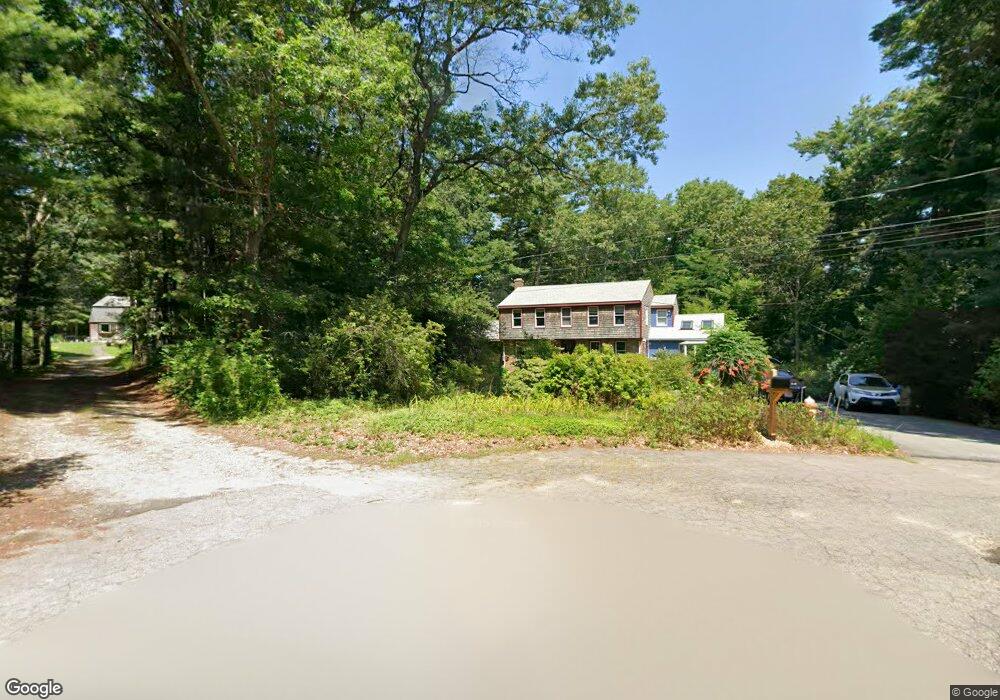
This home is located at 317 Ferry St, Marshfield, MA 02050 and is currently estimated at $917,563, approximately $383 per square foot. 317 Ferry St is a home located in Plymouth County with nearby schools including South River, Furnace Brook Middle School, and Marshfield High School.
Ownership History
We collect this data history from publicly available records. To have your information removed, we recommend requesting removal directly through your county’s website.
Purchase Details
Purchase Details
Home Values in the Area
Average Home Value in this Area
Purchase History
We collect this data history from publicly available records. To have your information removed, we recommend requesting removal directly through your county’s website.
| Date | Buyer | Sale Price | Title Company |
|---|---|---|---|
| -- | None Available | ||
| -- | None Available | ||
| -- | -- | ||
| -- | -- |
Mortgage History
We collect this data history from publicly available records. To have your information removed, we recommend requesting removal directly through your county’s website.
| Date | Status | Borrower | Loan Amount |
|---|---|---|---|
| Previous Owner | $100,000 | ||
| Previous Owner | $190,000 |
Tax History
We collect this data history from publicly available records. To have your information removed, we recommend requesting removal directly through your county’s website.
| Year | Tax Paid | Tax Assessment Tax Assessment Total Assessment is a certain percentage of the fair market value that is determined by local assessors to be the total taxable value of land and additions on the property. | Land | Improvement |
|---|---|---|---|---|
| 2025 | $7,760 | $783,800 | $320,200 | $463,600 |
| 2024 | $7,483 | $720,200 | $304,900 | $415,300 |
| 2023 | $6,920 | $642,500 | $283,100 | $359,400 |
| 2022 | $6,920 | $534,400 | $228,700 | $305,700 |
| 2021 | $6,610 | $501,100 | $226,500 | $274,600 |
| 2020 | $6,314 | $473,700 | $206,900 | $266,800 |
| 2019 | $6,131 | $458,200 | $206,900 | $251,300 |
| 2018 | $6,057 | $453,000 | $206,900 | $246,100 |
| 2017 | $5,790 | $422,000 | $196,000 | $226,000 |
| 2016 | $5,490 | $395,500 | $185,100 | $210,400 |
| 2015 | $5,187 | $390,300 | $185,100 | $205,200 |
| 2014 | $4,869 | $366,400 | $169,900 | $196,500 |
Map
- 25 Lynn St
- 56 Wrights Way
- 332 Grove St
- 24 Proctor St
- 23 Carolina Trail
- 361 Main St
- 4 Schooner Way Unit 4
- 61 Grove St
- 399 Plain St
- 1 Carpenter Ln
- 8 Duxbury St
- 47 Congress St
- 180 Plain St
- 24 Ryders Ln
- 173 S River St
- 30 Tupelo Rd
- 2 Proprietors Dr Unit 25
- 3 Proprietors Dr Unit 7
- 16 Hayloft Ln
- 134 Wellington Ave
Ask me questions while you tour the home.