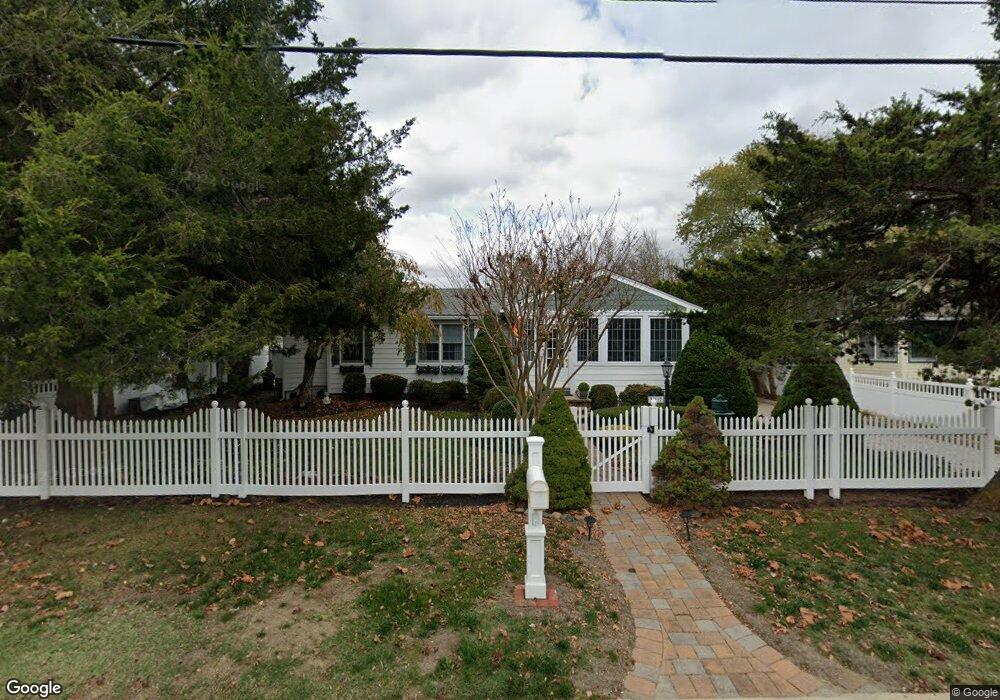
317 Fourth Ave Cape May, NJ 08204
Estimated Value: $843,212 - $1,765,000
Studio
--
Bath
1,606
Sq Ft
$740/Sq Ft
Est. Value
About This Home
This home is located at 317 Fourth Ave, Cape May, NJ 08204 and is currently estimated at $1,188,553, approximately $740 per square foot. 317 Fourth Ave is a home located in Cape May County with nearby schools including West Cape May Elementary School, Richard M. Teitelman School, and Lower Cape May Regional High School.
Ownership History
Date
Name
Owned For
Owner Type
Purchase Details
Closed on
Sep 29, 2000
Sold by
Laeyt Anthony J
Bought by
Perweiler Elyse
Current Estimated Value
Home Financials for this Owner
Home Financials are based on the most recent Mortgage that was taken out on this home.
Original Mortgage
$138,000
Outstanding Balance
$50,471
Interest Rate
7.96%
Estimated Equity
$1,138,082
Purchase Details
Closed on
Jan 29, 1993
Sold by
Dade Donald U and Dade Constance B
Bought by
Laeyt Anthony J and Laeyt Elizabeth A
Create a Home Valuation Report for This Property
The Home Valuation Report is an in-depth analysis detailing your home's value as well as a comparison with similar homes in the area
Home Values in the Area
Average Home Value in this Area
Purchase History
We collect this data history from publicly available records. To have your information removed, we recommend requesting removal directly through your county’s website.
| Date | Buyer | Sale Price | Title Company |
|---|---|---|---|
| Perweiler Elyse | $172,500 | -- | |
| Laeyt Anthony J | $64,000 | -- |
Source: Public Records
Mortgage History
We collect this data history from publicly available records. To have your information removed, we recommend requesting removal directly through your county’s website.
| Date | Status | Borrower | Loan Amount |
|---|---|---|---|
| Open | Perweiler Elyse | $138,000 |
Source: Public Records
Tax History
| Year | Tax Paid | Tax Assessment Tax Assessment Total Assessment is a certain percentage of the fair market value that is determined by local assessors to be the total taxable value of land and additions on the property. | Land | Improvement |
|---|---|---|---|---|
| 2025 | $6,378 | $424,100 | $290,000 | $134,100 |
| 2024 | $6,378 | $424,100 | $290,000 | $134,100 |
| 2023 | $6,451 | $424,100 | $290,000 | $134,100 |
| 2022 | $5,747 | $424,100 | $290,000 | $134,100 |
| 2021 | $5,428 | $424,100 | $290,000 | $134,100 |
| 2020 | $5,594 | $424,100 | $290,000 | $134,100 |
| 2019 | $5,159 | $411,400 | $290,000 | $121,400 |
| 2018 | $5,204 | $411,400 | $290,000 | $121,400 |
| 2017 | $5,027 | $411,400 | $290,000 | $121,400 |
| 2016 | $5,027 | $411,400 | $290,000 | $121,400 |
| 2015 | $4,727 | $411,400 | $290,000 | $121,400 |
| 2014 | $4,727 | $411,400 | $290,000 | $121,400 |
Source: Public Records
Map
Nearby Homes
- 408 Atlantic Ave
- 405 4th Ave Unit Far East
- 308 Atlantic Ave
- 0 Fifth Ave
- 301 Second Ave
- 414 Green St
- 123 Sixth Ave
- 127 Third Ave
- 420 Broadway Unit 1
- 420 Broadway Unit 2
- 111 Leaming Ave
- 3 Grand Ave
- 101 Sunset Blvd Unit 2
- 101 Sunset Blvd Unit 3
- 106 Burgins Ln
- 6 Congress St W
- 141 Pearl Ave
- 29 Westwood Dr
- 209 Park Blvd Unit 4
- 551 Elmira St
Your Personal Tour Guide
Ask me questions while you tour the home.