
Seller's Agent in 2025
Fred Rubio
Marcus & Millichap
(408) 314-3009
4 in this area
31 Total Sales
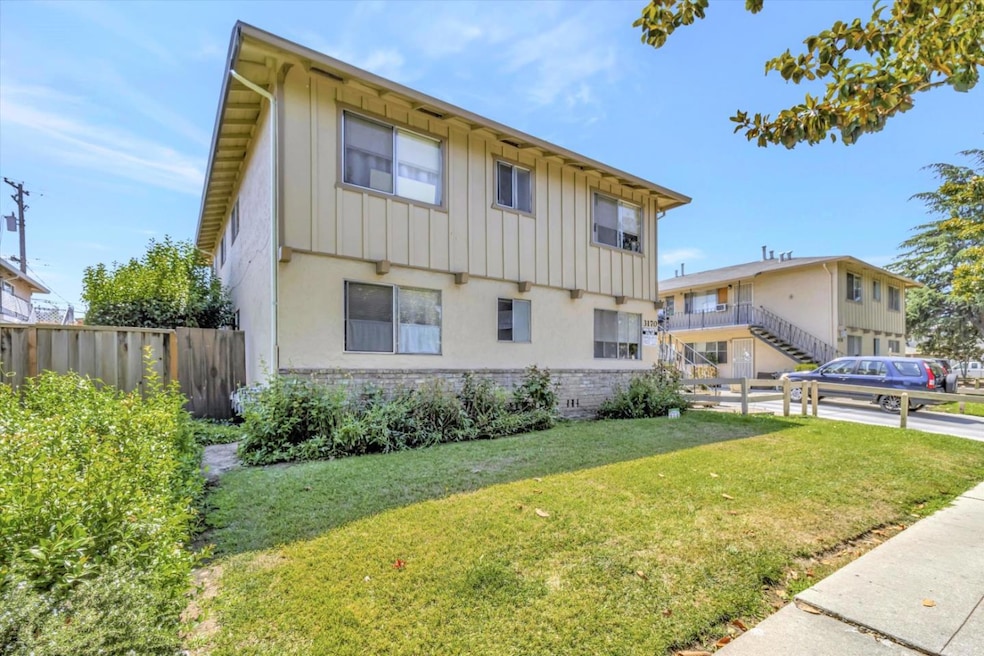


3170-3178 Williamsburg Drive offers two side by side fourplexes located in San Jose, CA. The asset offers a combined 14,896 SF of land and 5,760 SF of building area. All of the units are two bed, one bath units that are primed for a new investor to renovate the interiors and bring the rents to market.
Last Agent to Sell the Property
Marcus & Millichap License #01984041 Listed on: 02/25/2025
| Date | Event | Price | List to Sale | Price per Sq Ft | Prior Sale |
|---|---|---|---|---|---|
| 07/28/2025 07/28/25 | Sold | $1,497,000 | -0.1% | $520 / Sq Ft | |
| 06/26/2025 06/26/25 | Pending | -- | -- | -- | |
| 06/05/2025 06/05/25 | Price Changed | $1,498,000 | -3.4% | $520 / Sq Ft | |
| 04/28/2025 04/28/25 | Price Changed | $1,550,000 | -8.0% | $538 / Sq Ft | |
| 02/25/2025 02/25/25 | For Sale | $1,685,000 | +27.2% | $585 / Sq Ft | |
| 11/13/2023 11/13/23 | Sold | $1,325,000 | -8.6% | $460 / Sq Ft | View Prior Sale |
| 11/03/2023 11/03/23 | Pending | -- | -- | -- | |
| 11/01/2023 11/01/23 | Price Changed | $1,450,000 | -12.1% | $503 / Sq Ft | |
| 10/02/2023 10/02/23 | For Sale | $1,650,000 | -- | $573 / Sq Ft |
| Year | Tax Paid | Tax Assessment Tax Assessment Total Assessment is a certain percentage of the fair market value that is determined by local assessors to be the total taxable value of land and additions on the property. | Land | Improvement |
|---|---|---|---|---|
| 2025 | $17,987 | $1,351,500 | $1,071,000 | $280,500 |
| 2024 | $17,987 | $1,325,000 | $1,050,000 | $275,000 |
| 2023 | $6,500 | $375,214 | $191,598 | $183,616 |
| 2022 | $6,501 | $367,858 | $187,842 | $180,016 |
| 2021 | $6,313 | $360,646 | $184,159 | $176,487 |
| 2020 | $6,214 | $356,949 | $182,271 | $174,678 |
| 2019 | $6,126 | $349,951 | $178,698 | $171,253 |
| 2018 | $5,969 | $343,091 | $175,195 | $167,896 |
| 2017 | $5,884 | $336,364 | $171,760 | $164,604 |
| 2016 | $5,558 | $329,770 | $168,393 | $161,377 |
| 2015 | $5,447 | $324,817 | $165,864 | $158,953 |
| 2014 | $5,126 | $318,455 | $162,615 | $155,840 |
Seller's Agent in 2025
Fred Rubio
Marcus & Millichap
(408) 314-3009
4 in this area
31 Total Sales
Buyer's Agent in 2025
Sherry Vu
Maxreal
(408) 646-7798
2 in this area
79 Total Sales
Source: MLSListings
MLS Number: ML81995424
APN: 305-02-026
Disclaimer: Certain information contained herein is derived from information provided by parties other than Homes.com. All information provided is deemed reliable, but is not guaranteed to be accurate and should be independently verified.
![]() Property Information © 2026 MLSListings Inc. All rights reserved. Listing information is deemed reliable but not guaranteed. Certain information contained herein is derived from information which is the licensed property of, and copyrighted by, MLSListings Inc. The viewer acknowledges ownership and validity of its copyright. Information provided is for personal, non-commercial use by a viewer with a bona fide interest in the purchase or sale of real estate of the type being offered via this website or other electronic means. The viewer is prohibited from copying, redistributing or retransmitting any of the data or information provided by MLSListing, Inc.
Property Information © 2026 MLSListings Inc. All rights reserved. Listing information is deemed reliable but not guaranteed. Certain information contained herein is derived from information which is the licensed property of, and copyrighted by, MLSListings Inc. The viewer acknowledges ownership and validity of its copyright. Information provided is for personal, non-commercial use by a viewer with a bona fide interest in the purchase or sale of real estate of the type being offered via this website or other electronic means. The viewer is prohibited from copying, redistributing or retransmitting any of the data or information provided by MLSListing, Inc.
Ask me questions while you tour the home.