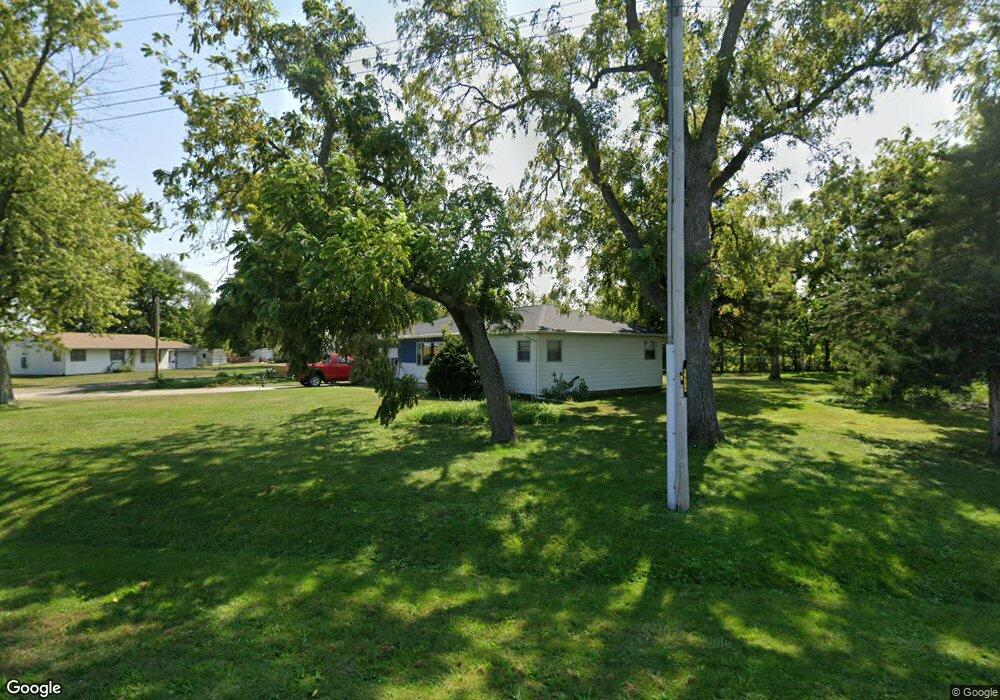
318 E North Ave Rankin, IL 60960
Estimated Value: $99,000 - $109,097
Studio
--
Bath
--
Sq Ft
16,117
Sq Ft Lot
About This Home
This home is located at 318 E North Ave, Rankin, IL 60960 and is currently estimated at $104,274. 318 E North Ave is a home located in Vermilion County with nearby schools including Maple Elementary School, John Greer Elementary School, and Hoopeston Area Middle School.
Ownership History
Date
Name
Owned For
Owner Type
Purchase Details
Closed on
Mar 18, 2024
Sold by
Hays Tamara
Bought by
Perez Mario Adrian
Current Estimated Value
Home Financials for this Owner
Home Financials are based on the most recent Mortgage that was taken out on this home.
Original Mortgage
$94,881
Outstanding Balance
$93,264
Interest Rate
6.5%
Mortgage Type
FHA
Estimated Equity
$11,010
Purchase Details
Closed on
Mar 7, 2024
Sold by
Brotherton Buddy
Bought by
Hays Tamara
Home Financials for this Owner
Home Financials are based on the most recent Mortgage that was taken out on this home.
Original Mortgage
$94,881
Outstanding Balance
$93,264
Interest Rate
6.5%
Mortgage Type
FHA
Estimated Equity
$11,010
Purchase Details
Closed on
Jan 26, 2021
Sold by
Joseph Diskin Donald
Bought by
Brotherton Buddy and Hays Tamara
Home Financials for this Owner
Home Financials are based on the most recent Mortgage that was taken out on this home.
Original Mortgage
$57,439
Interest Rate
2.71%
Mortgage Type
FHA
Create a Home Valuation Report for This Property
The Home Valuation Report is an in-depth analysis detailing your home's value as well as a comparison with similar homes in the area
Purchase History
| Date | Buyer | Sale Price | Title Company |
|---|---|---|---|
| Perez Mario Adrian | $99,500 | None Listed On Document | |
| Hays Tamara | -- | None Listed On Document | |
| Brotherton Buddy | -- | -- |
Source: Public Records
Mortgage History
| Date | Status | Borrower | Loan Amount |
|---|---|---|---|
| Open | Perez Mario Adrian | $94,881 | |
| Closed | Perez Mario Adrian | $4,975 | |
| Previous Owner | Brotherton Buddy | $57,439 |
Source: Public Records
Tax History
| Year | Tax Paid | Tax Assessment Tax Assessment Total Assessment is a certain percentage of the fair market value that is determined by local assessors to be the total taxable value of land and additions on the property. | Land | Improvement |
|---|---|---|---|---|
| 2024 | $2,034 | $28,886 | $1,737 | $27,149 |
| 2023 | $2,034 | $26,239 | $1,578 | $24,661 |
| 2022 | $1,683 | $24,073 | $1,448 | $22,625 |
| 2021 | $7 | $22,498 | $1,353 | $21,145 |
| 2020 | $7 | $28,708 | $2,130 | $26,578 |
| 2019 | $7 | $27,951 | $2,074 | $25,877 |
| 2018 | $7 | $26,122 | $1,938 | $24,184 |
| 2015 | -- | $24,900 | $1,847 | $23,053 |
| 2014 | -- | $24,061 | $1,785 | $22,276 |
| 2013 | -- | $24,061 | $1,785 | $22,276 |
Source: Public Records
Map
Nearby Homes
- 201 N Johnson St
- 121 S Main St
- 207 S Grove St
- 428 E 5th Ave
- 329 E 5th Ave
- 415 E 5th Ave
- 203 W 5th Ave
- 502 S Johnson St
- 2131 E 4100 North Rd
- 40980 State Route 49
- 40598 State Route 49
- South Main Rd
- N 1300 Rd E
- 41681 Main
- 41681 N Main
- 1269 E 500 North Rd
- 1271 E 500 North Rd
- 122 W Harrison Ave
- Lot 7 Sandy Bay St
- 212 N 7th St
- 318 E North Ave
- 316 N Iroquois St
- 319 N Iroquois St
- 323 N Dixon St
- 308 N Iroquois St
- 309 N Dixon St
- 304 N Iroquois St
- 304 E 1st Ave
- 303 N Dixon St
- 300 E North Ave Unit 2579
- 328 N Dixon St
- 316 N Dixon St
- 324 N Dixon St
- 225 N Dixon St
- 225 E 1st Ave
- 312 N Dixon St
- 211 N Iroquois St
- 304 N Dixon St
- 219 N Dixon St
- 210 N Iroquois St
Your Personal Tour Guide
Ask me questions while you tour the home.