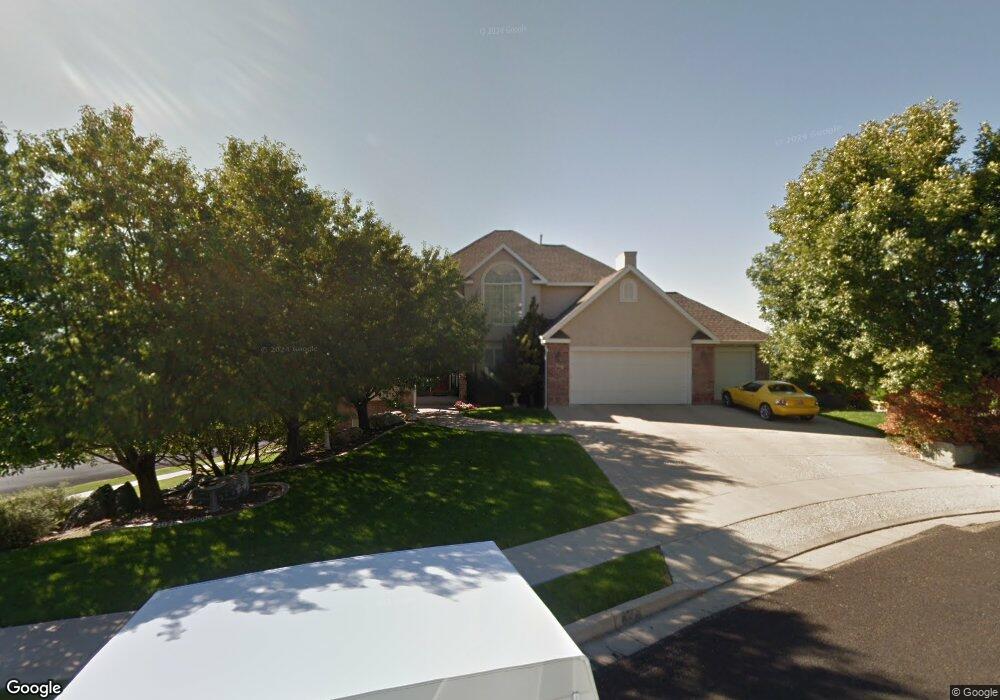
318 Sage Cir Logan, UT 84321
Wilson NeighborhoodEstimated Value: $726,000 - $823,000
6
Beds
4
Baths
4,587
Sq Ft
$172/Sq Ft
Est. Value
About This Home
This home is located at 318 Sage Cir, Logan, UT 84321 and is currently estimated at $788,231, approximately $171 per square foot. 318 Sage Cir is a home located in Cache County with nearby schools including Wilson School, Mount Logan Middle School, and Logan High School.
Ownership History
Date
Name
Owned For
Owner Type
Purchase Details
Closed on
Aug 26, 2020
Sold by
Ade Nicholas Andrew
Bought by
Ade Nicholas Andrew and Ade Michelle
Current Estimated Value
Home Financials for this Owner
Home Financials are based on the most recent Mortgage that was taken out on this home.
Original Mortgage
$418,875
Outstanding Balance
$370,032
Interest Rate
2.9%
Mortgage Type
New Conventional
Estimated Equity
$418,199
Purchase Details
Closed on
Mar 7, 2011
Sold by
Harris Jeffrey Scott
Bought by
Harris Jeffrey Scott and Harris Kathleen P
Home Financials for this Owner
Home Financials are based on the most recent Mortgage that was taken out on this home.
Original Mortgage
$316,000
Interest Rate
3.87%
Mortgage Type
New Conventional
Purchase Details
Closed on
Sep 4, 2002
Sold by
Nielsen Kevin J and Nielsen Alayne H
Bought by
Nielsen Kevin J and Nielsen Alayne H
Create a Home Valuation Report for This Property
The Home Valuation Report is an in-depth analysis detailing your home's value as well as a comparison with similar homes in the area
Home Values in the Area
Average Home Value in this Area
Purchase History
We collect this data history from publicly available records. To have your information removed, we recommend requesting removal directly through your county’s website.
| Date | Buyer | Sale Price | Title Company |
|---|---|---|---|
| Ade Nicholas Andrew | -- | American Secure Title Logan | |
| Ade Nicholas Andrew | -- | American Secure Title Logan | |
| Harris Jeffrey Scott | -- | Hickman Land Title Company | |
| Harris Jeffrey Scott | -- | Pinnacle Title Ins Agency | |
| Nielsen Kevin J | -- | Northern Title Company | |
| Nielsen Kevin J | -- | Northern Title Company |
Source: Public Records
Mortgage History
We collect this data history from publicly available records. To have your information removed, we recommend requesting removal directly through your county’s website.
| Date | Status | Borrower | Loan Amount |
|---|---|---|---|
| Open | Ade Nicholas Andrew | $418,875 | |
| Previous Owner | Harris Jeffrey Scott | $316,000 |
Source: Public Records
Tax History
| Year | Tax Paid | Tax Assessment Tax Assessment Total Assessment is a certain percentage of the fair market value that is determined by local assessors to be the total taxable value of land and additions on the property. | Land | Improvement |
|---|---|---|---|---|
| 2025 | $3,229 | $417,660 | $0 | $0 |
| 2024 | $3,315 | $415,225 | $0 | $0 |
| 2023 | $3,517 | $419,975 | $0 | $0 |
| 2022 | $3,372 | $375,975 | $0 | $0 |
| 2021 | $3,314 | $570,870 | $120,000 | $450,870 |
| 2020 | $3,478 | $539,221 | $120,000 | $419,221 |
| 2019 | $3,635 | $539,221 | $120,000 | $419,221 |
| 2018 | $3,578 | $484,540 | $120,000 | $364,540 |
| 2017 | $3,083 | $220,770 | $0 | $0 |
| 2016 | $3,197 | $220,770 | $0 | $0 |
| 2015 | $2,783 | $191,980 | $0 | $0 |
| 2014 | $2,516 | $191,980 | $0 | $0 |
| 2013 | -- | $191,980 | $0 | $0 |
Source: Public Records
Map
Nearby Homes
- 1532 Mount Logan Dr
- 243 Eastridge Ln
- 85 S 1170 E
- 52 N 1250 E
- 805 E 525 N Unit 44
- 720 E 525 N Unit 32
- 147 Winding Way Unit 50
- 510 N Sarah St
- 1290 Cliffside Dr
- 730 E 400 N Unit 13
- 965 Johnson Ln
- 83 Canterbury Cir
- 1340 Cliffside Dr
- 525 N 400 E
- 676 N 275 E Unit 614
- 648 N 275 E
- 263 E 690 N
- 27 Canterbury Ln
- 1164 E Mountain Rd
- 657 N 200 E
- 307 Sage Cir
- 1405 Mount Logan Dr
- 330 Sage Cir Unit 4
- 1408 Mountain Rd
- 1408 Mount Logan Dr
- 1434 Mount Logan Dr
- 308 Sage Cir
- 322 Sage Cir
- 1452 Mountain Rd
- 1452 Mount Logan Dr
- 1407 Kendrick Ct
- 1393 Mount Logan Loop
- 1435 Kendrick Ct
- 1463 Mount Logan Dr
- 1485 Mount Logan Dr
- 1491 Mount Logan Dr
- 1390 E Red Fox Trace
- 1453 Kendrick Ct
- 1507 Mount Logan Dr
- 1460 Mount Logan Dr
Your Personal Tour Guide
Ask me questions while you tour the home.