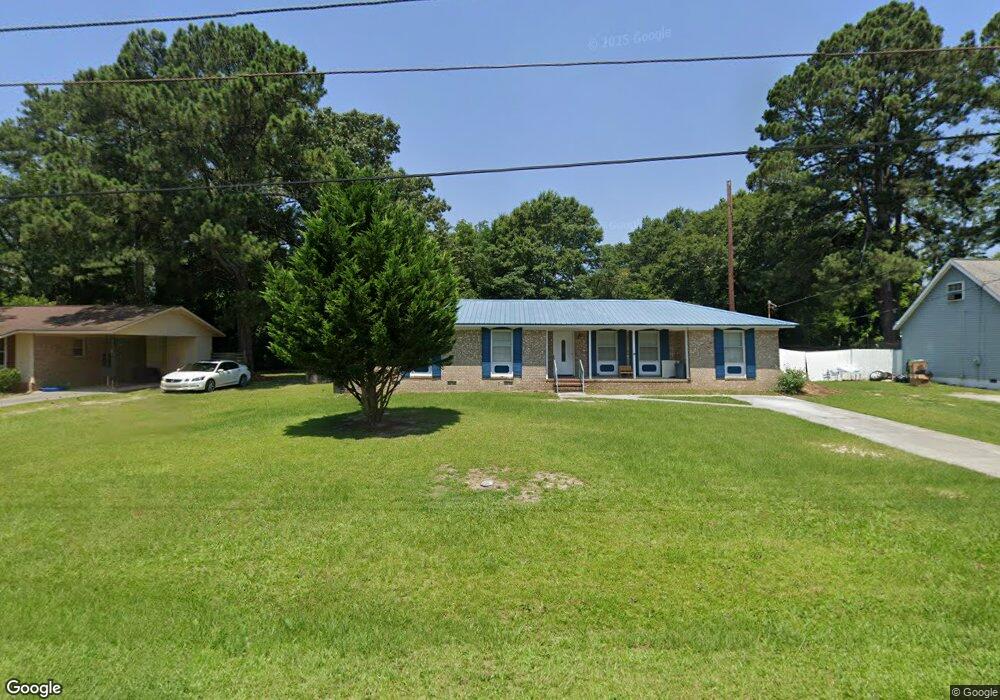
319 Apollo Dr Thomson, GA 30824
Estimated Value: $156,000 - $158,686
3
Beds
2
Baths
1,487
Sq Ft
$106/Sq Ft
Est. Value
About This Home
This home is located at 319 Apollo Dr, Thomson, GA 30824 and is currently estimated at $157,343, approximately $105 per square foot. 319 Apollo Dr is a home located in McDuffie County with nearby schools including Thomson High School.
Ownership History
Date
Name
Owned For
Owner Type
Purchase Details
Closed on
Aug 9, 2022
Sold by
Anderson Kaye
Bought by
Berry Tarnisha
Current Estimated Value
Purchase Details
Closed on
May 3, 2008
Sold by
Anderson Kaye
Bought by
Anderson Kaye
Purchase Details
Closed on
Mar 8, 2000
Sold by
Anderson Pamela D
Bought by
Anderson Ronald and Anderson Kaye
Purchase Details
Closed on
Sep 5, 1997
Sold by
Anderson Kaye H
Bought by
Anderson Pamela D
Purchase Details
Closed on
Jul 22, 1976
Bought by
Anderson Kaye H
Create a Home Valuation Report for This Property
The Home Valuation Report is an in-depth analysis detailing your home's value as well as a comparison with similar homes in the area
Home Values in the Area
Average Home Value in this Area
Purchase History
| Date | Buyer | Sale Price | Title Company |
|---|---|---|---|
| Berry Tarnisha | $110,000 | -- | |
| Anderson Kaye | -- | -- | |
| Anderson Ronald | $48,200 | -- | |
| Anderson Pamela D | $50,000 | -- | |
| Anderson Kaye H | -- | -- |
Source: Public Records
Tax History
| Year | Tax Paid | Tax Assessment Tax Assessment Total Assessment is a certain percentage of the fair market value that is determined by local assessors to be the total taxable value of land and additions on the property. | Land | Improvement |
|---|---|---|---|---|
| 2025 | $1,583 | $54,747 | $1,713 | $53,034 |
| 2024 | $1,583 | $52,212 | $1,663 | $50,549 |
| 2023 | $1,560 | $50,097 | $1,584 | $48,513 |
| 2022 | $1,194 | $46,253 | $1,584 | $44,669 |
| 2021 | $897 | $37,348 | $1,584 | $35,764 |
| 2020 | $1,052 | $42,043 | $7,155 | $34,888 |
| 2019 | $1,060 | $42,043 | $7,155 | $34,888 |
| 2018 | $1,070 | $42,043 | $7,155 | $34,888 |
| 2017 | $1,044 | $42,043 | $7,155 | $34,888 |
| 2016 | $1,049 | $42,043 | $7,155 | $34,888 |
| 2015 | $926 | $42,220 | $7,155 | $35,065 |
| 2014 | $930 | $42,220 | $7,155 | $35,065 |
| 2013 | -- | $44,985 | $7,154 | $37,830 |
Source: Public Records
Map
Nearby Homes
- 466 Edgar Cir
- 223 Holt St
- 318 White Oak St
- 301 Cleveland St
- 535 White Oak St
- 641 Ellington Ave
- 219 White Oak St
- 236 Greenway St
- 609 Main St
- 304 Neal St
- 542 Lee St
- 0 Harrison Rd Unit 543150
- 125 Lee St
- 123 Lee St
- 624 Hemlock Dr
- 615 Hemlock Dr
- 1289 Huntly Cir
- 000 Washington Rd
- 410 Johns Rd
- 2033 April Dawn Trail
Your Personal Tour Guide
Ask me questions while you tour the home.