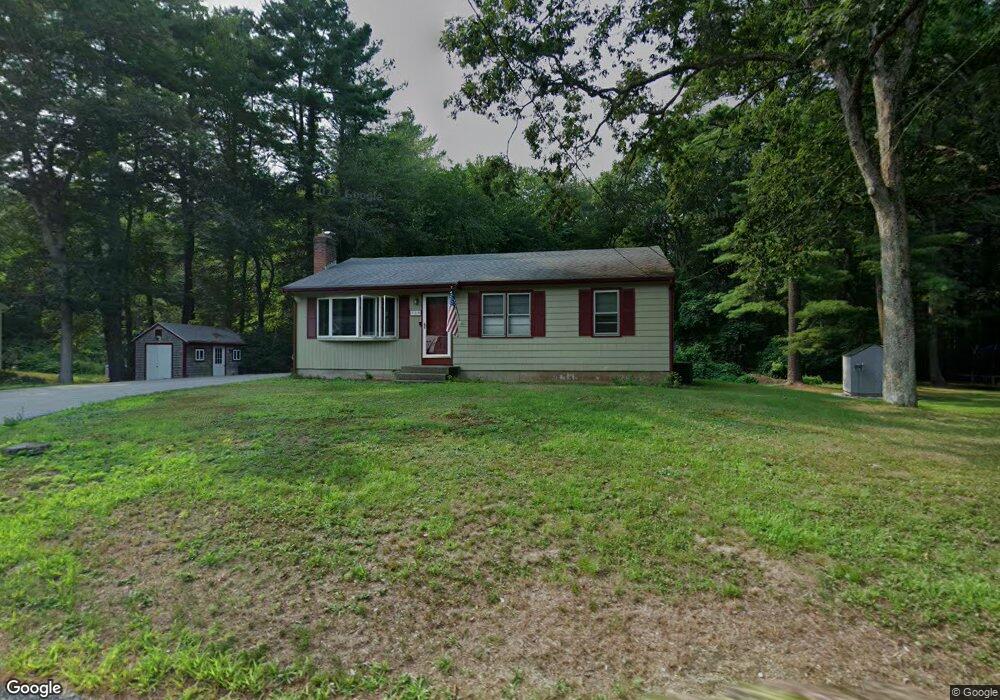
319 Balcom St Mansfield, MA 02048
Estimated Value: $519,552 - $601,000
3
Beds
2
Baths
1,120
Sq Ft
$506/Sq Ft
Est. Value
About This Home
This home is located at 319 Balcom St, Mansfield, MA 02048 and is currently estimated at $566,888, approximately $506 per square foot. 319 Balcom St is a home located in Bristol County with nearby schools including Everett W. Robinson Elementary School, Jordan/Jackson Elementary School, and Harold L. Qualters Middle School.
Ownership History
Date
Name
Owned For
Owner Type
Purchase Details
Closed on
May 28, 2024
Sold by
Lonergan Dianne M
Bought by
319 Balcom St Rt and Lonergan
Current Estimated Value
Purchase Details
Closed on
Jul 6, 1984
Bought by
Lonergan John F and Lonergan Dianne M
Create a Home Valuation Report for This Property
The Home Valuation Report is an in-depth analysis detailing your home's value as well as a comparison with similar homes in the area
Home Values in the Area
Average Home Value in this Area
Purchase History
| Date | Buyer | Sale Price | Title Company |
|---|---|---|---|
| 319 Balcom St Rt | -- | None Available | |
| 319 Balcom St Rt | -- | None Available | |
| Lonergan John F | -- | -- |
Source: Public Records
Mortgage History
| Date | Status | Borrower | Loan Amount |
|---|---|---|---|
| Previous Owner | Lonergan John F | $15,000 | |
| Previous Owner | Lonergan John F | $79,000 | |
| Previous Owner | Lonergan John F | $10,000 |
Source: Public Records
Tax History
| Year | Tax Paid | Tax Assessment Tax Assessment Total Assessment is a certain percentage of the fair market value that is determined by local assessors to be the total taxable value of land and additions on the property. | Land | Improvement |
|---|---|---|---|---|
| 2025 | $5,853 | $444,400 | $241,800 | $202,600 |
| 2024 | $5,249 | $388,800 | $241,800 | $147,000 |
| 2023 | $5,215 | $370,100 | $241,800 | $128,300 |
| 2022 | $5,076 | $334,600 | $223,800 | $110,800 |
| 2021 | $3,761 | $317,800 | $195,900 | $121,900 |
| 2020 | $3,682 | $304,800 | $186,600 | $118,200 |
| 2019 | $4,257 | $279,700 | $155,400 | $124,300 |
| 2018 | $4,016 | $257,900 | $148,200 | $109,700 |
| 2017 | $3,194 | $259,800 | $144,000 | $115,800 |
| 2016 | $3,840 | $249,200 | $137,100 | $112,100 |
| 2015 | $3,579 | $230,900 | $137,100 | $93,800 |
Source: Public Records
Map
Nearby Homes
Your Personal Tour Guide
Ask me questions while you tour the home.