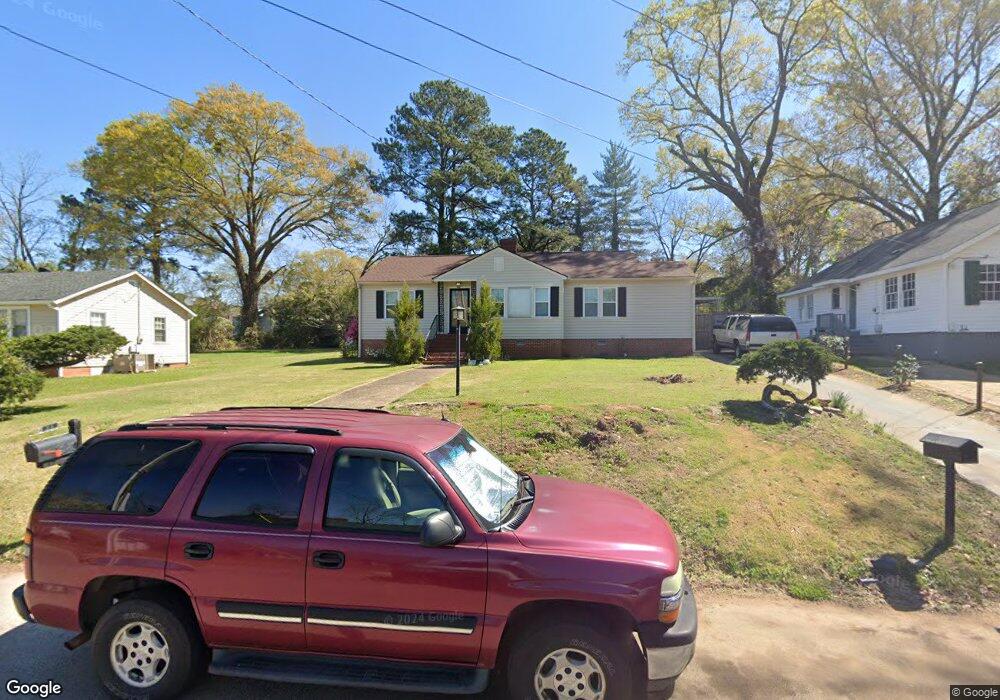
319 N Lee St Lagrange, GA 30240
Estimated Value: $172,000 - $208,077
4
Beds
2
Baths
1,720
Sq Ft
$111/Sq Ft
Est. Value
About This Home
This home is located at 319 N Lee St, Lagrange, GA 30240 and is currently estimated at $190,519, approximately $110 per square foot. 319 N Lee St is a home located in Troup County with nearby schools including Ethel W. Kight Elementary School, Hollis Hand Elementary School, and Franklin Forest Elementary School.
Ownership History
Date
Name
Owned For
Owner Type
Purchase Details
Closed on
Jun 9, 2016
Sold by
Traylor Billy Monroe
Bought by
Friedler Lane and Lewis Kimberly H
Current Estimated Value
Home Financials for this Owner
Home Financials are based on the most recent Mortgage that was taken out on this home.
Original Mortgage
$48,986
Outstanding Balance
$20,393
Interest Rate
2.81%
Mortgage Type
New Conventional
Estimated Equity
$170,126
Purchase Details
Closed on
Dec 2, 1998
Sold by
James Traylor
Bought by
Traylor Sallie B
Purchase Details
Closed on
Jan 1, 1962
Sold by
James W Traylor
Bought by
James Traylor
Create a Home Valuation Report for This Property
The Home Valuation Report is an in-depth analysis detailing your home's value as well as a comparison with similar homes in the area
Purchase History
| Date | Buyer | Sale Price | Title Company |
|---|---|---|---|
| Friedler Lane | $86,000 | -- | |
| Traylor Sallie B | -- | -- | |
| James Traylor | -- | -- |
Source: Public Records
Mortgage History
| Date | Status | Borrower | Loan Amount |
|---|---|---|---|
| Open | Friedler Lane | $48,986 |
Source: Public Records
Tax History
| Year | Tax Paid | Tax Assessment Tax Assessment Total Assessment is a certain percentage of the fair market value that is determined by local assessors to be the total taxable value of land and additions on the property. | Land | Improvement |
|---|---|---|---|---|
| 2025 | $1,560 | $66,140 | $10,000 | $56,140 |
| 2024 | $1,269 | $46,540 | $7,960 | $38,580 |
| 2023 | $1,179 | $43,220 | $7,960 | $35,260 |
| 2022 | $1,158 | $41,500 | $7,960 | $33,540 |
| 2021 | $1,094 | $36,276 | $7,960 | $28,316 |
| 2020 | $1,094 | $36,276 | $7,960 | $28,316 |
| 2019 | $1,014 | $33,616 | $7,960 | $25,656 |
| 2018 | $1,014 | $33,616 | $7,960 | $25,656 |
| 2017 | $1,014 | $33,616 | $7,960 | $25,656 |
| 2016 | $906 | $30,030 | $8,000 | $22,030 |
| 2015 | $738 | $32,222 | $10,192 | $22,030 |
| 2014 | $703 | $31,063 | $10,192 | $20,871 |
| 2013 | -- | $32,731 | $10,192 | $22,539 |
Source: Public Records
Map
Nearby Homes
Your Personal Tour Guide
Ask me questions while you tour the home.