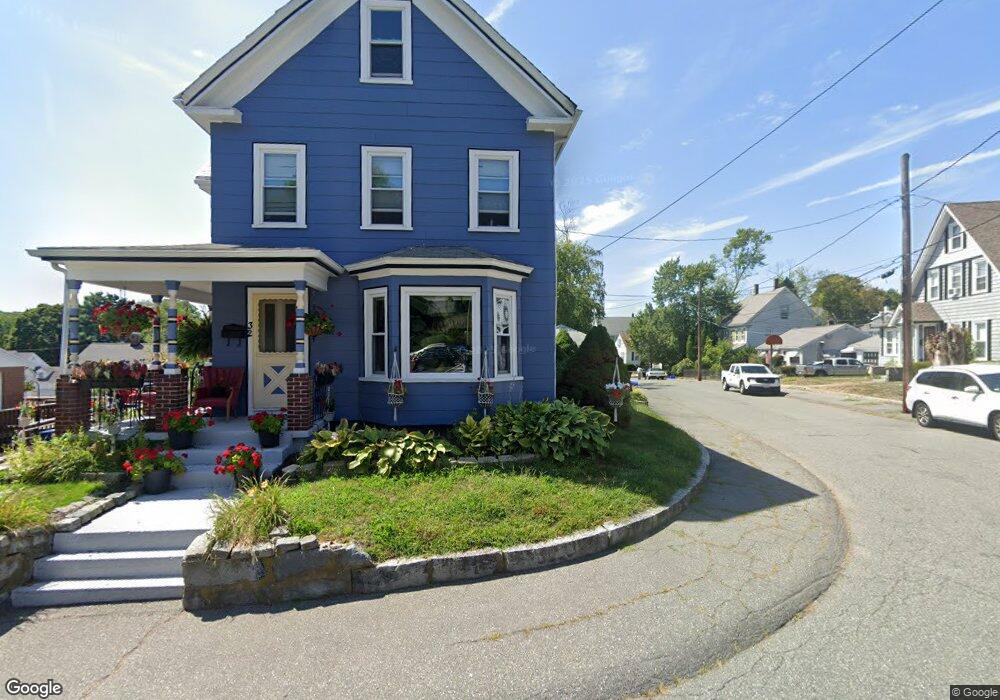
32 Barry St Quincy, MA 02169
South Quincy NeighborhoodEstimated Value: $791,000 - $897,000
4
Beds
3
Baths
1,844
Sq Ft
$451/Sq Ft
Est. Value
About This Home
This home is located at 32 Barry St, Quincy, MA 02169 and is currently estimated at $832,441, approximately $451 per square foot. 32 Barry St is a home located in Norfolk County with nearby schools including South West Middle School, Lincoln-Hancock Community School, and Quincy High School.
Ownership History
Date
Name
Owned For
Owner Type
Purchase Details
Closed on
Apr 30, 1997
Sold by
Decrio Gary S and Deicrio Karen J
Bought by
Chiavaroli John J
Current Estimated Value
Home Financials for this Owner
Home Financials are based on the most recent Mortgage that was taken out on this home.
Original Mortgage
$124,000
Interest Rate
7.85%
Mortgage Type
Purchase Money Mortgage
Purchase Details
Closed on
Nov 20, 1991
Sold by
Chiavaroli Eunice C
Bought by
Deiorio Gary S and Deiorio Karen J
Create a Home Valuation Report for This Property
The Home Valuation Report is an in-depth analysis detailing your home's value as well as a comparison with similar homes in the area
Home Values in the Area
Average Home Value in this Area
Purchase History
| Date | Buyer | Sale Price | Title Company |
|---|---|---|---|
| Chiavaroli John J | $155,000 | -- | |
| Chiavaroli John J | $155,000 | -- | |
| Deiorio Gary S | $123,750 | -- | |
| Deiorio Gary S | $123,750 | -- |
Source: Public Records
Mortgage History
| Date | Status | Borrower | Loan Amount |
|---|---|---|---|
| Open | Deiorio Gary S | $297,255 | |
| Closed | Deiorio Gary S | $136,200 | |
| Closed | Deiorio Gary S | $124,000 |
Source: Public Records
Tax History
| Year | Tax Paid | Tax Assessment Tax Assessment Total Assessment is a certain percentage of the fair market value that is determined by local assessors to be the total taxable value of land and additions on the property. | Land | Improvement |
|---|---|---|---|---|
| 2025 | $8,360 | $725,100 | $300,600 | $424,500 |
| 2024 | $7,869 | $698,200 | $286,300 | $411,900 |
| 2023 | $7,478 | $671,900 | $272,600 | $399,300 |
| 2022 | $6,983 | $582,900 | $218,200 | $364,700 |
| 2021 | $7,106 | $585,300 | $218,200 | $367,100 |
| 2020 | $7,034 | $565,900 | $218,200 | $347,700 |
| 2019 | $6,776 | $539,900 | $211,800 | $328,100 |
| 2018 | $6,387 | $478,800 | $196,100 | $282,700 |
| 2017 | $6,443 | $454,700 | $186,700 | $268,000 |
| 2016 | $5,893 | $410,400 | $169,800 | $240,600 |
| 2015 | $5,675 | $388,700 | $160,200 | $228,500 |
| 2014 | $5,045 | $339,500 | $160,200 | $179,300 |
Source: Public Records
Map
Nearby Homes
- 39 Cross St
- 40 Cross St Unit 1
- 211 Copeland St
- 230 Willard St Unit 102
- 230 Willard St Unit 207
- 149 Reservoir Rd
- 580 Quarry St Unit 13
- 84 West St Unit 1
- 21 Arthur St
- 510 Willard St
- 91 Garfield St
- 9 Westford St
- 156 West St
- 132 Centre St
- 165 Whitwell St
- 41 Wallace Rd
- 475 Beale St
- 52 Packards Ln Unit 4
- 211 West St Unit 11B
- 211 West St Unit 12B
Your Personal Tour Guide
Ask me questions while you tour the home.