32 Bubbling Brook Rd Walpole, MA 02081
Walpole AreaEstimated Value: $1,435,000 - $1,741,000
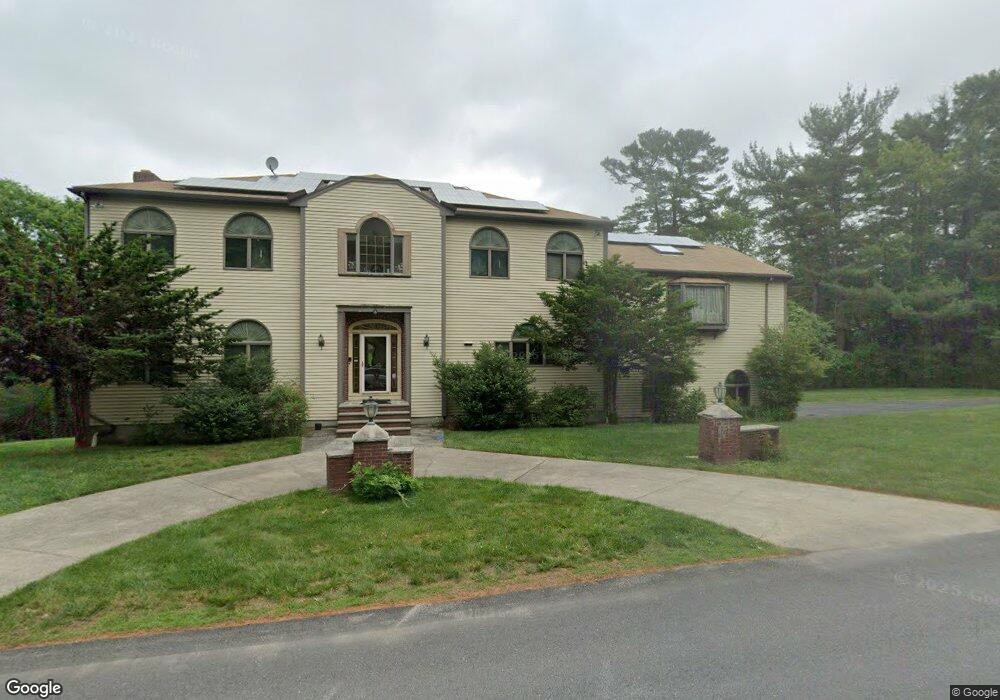
About This Home
This home is located at 32 Bubbling Brook Rd, Walpole, MA 02081 and is currently estimated at $1,601,485, approximately $383 per square foot. 32 Bubbling Brook Rd is a home located in Norfolk County with nearby schools including Fisher School, Walpole Middle School, and Walpole High School.
Ownership History
We collect this data history from publicly available records. To have your information removed, we recommend requesting removal directly through your county’s website.
Purchase Details
Home Values in the Area
Average Home Value in this Area
Purchase History
We collect this data history from publicly available records. To have your information removed, we recommend requesting removal directly through your county’s website.
| Date | Buyer | Sale Price | Title Company |
|---|---|---|---|
| $565,000 | -- |
Mortgage History
We collect this data history from publicly available records. To have your information removed, we recommend requesting removal directly through your county’s website.
| Date | Status | Borrower | Loan Amount |
|---|---|---|---|
| Open | $249,999 | ||
| Closed | $356,200 | ||
| Closed | $400,000 | ||
| Closed | $260,000 | ||
| Closed | $206,000 | ||
| Closed | $400,000 | ||
| Closed | $250,000 | ||
| Closed | $417,000 | ||
| Closed | $200,000 | ||
| Closed | $333,700 | ||
| Closed | $100,000 | ||
| Closed | $322,700 | ||
| Closed | $300,000 | ||
| Closed | $452,000 |
Tax History
We collect this data history from publicly available records. To have your information removed, we recommend requesting removal directly through your county’s website.
| Year | Tax Paid | Tax Assessment Tax Assessment Total Assessment is a certain percentage of the fair market value that is determined by local assessors to be the total taxable value of land and additions on the property. | Land | Improvement |
|---|---|---|---|---|
| 2025 | $16,516 | $1,287,300 | $387,600 | $899,700 |
| 2024 | $15,896 | $1,202,400 | $372,800 | $829,600 |
| 2023 | $14,569 | $1,048,900 | $323,900 | $725,000 |
| 2022 | $13,303 | $920,000 | $299,800 | $620,200 |
| 2021 | $13,116 | $883,800 | $282,800 | $601,000 |
| 2020 | $12,361 | $824,600 | $276,400 | $548,200 |
| 2019 | $12,180 | $806,600 | $266,700 | $539,900 |
| 2018 | $12,408 | $812,600 | $254,200 | $558,400 |
| 2017 | $12,077 | $787,800 | $244,500 | $543,300 |
| 2016 | $11,891 | $764,200 | $245,900 | $518,300 |
| 2015 | $11,729 | $747,100 | $243,800 | $503,300 |
| 2014 | $11,313 | $717,800 | $243,800 | $474,000 |
Map
- 19 Bubbling Brook Rd
- 4 Skyview Dr
- 11 Reynolds Farm Way Unit 11
- 1080 North St
- 7 Pettees Pond Ln
- 45 Blueberry Ln
- 1689 High St
- 2 Stonegate Ln
- 485 Oak St
- 9 Stonegate Dr
- 5 Albemarle Rd
- 114 Albemarle Rd
- 845 North St
- 28 Lancelot Ct
- 18 Crystal Hill Terrace
- 153 Walpole St
- 9 Schaffner Ln
- 11 Briarwood Dr
- 269 Bullard St
- 19 Avon Rd
- 27 Bubbling Brook Rd
- 31 Bubbling Brook Rd
- 28 Bubbling Brook Rd
- 40 Bubbling Brook Rd
- 35 Bubbling Brook Rd
- 24 Bubbling Brook Rd
- 24 Bubbling Brook Rd Unit 999
- 35 Trailside Dr
- 20 Bubbling Brook Rd
- 117 Margery Ln
- 107 Margery Ln
- 39 Bubbling Brook Rd
- 127 Margery Ln
- 29 Trailside Dr
- 15 Bubbling Brook Rd
- 97 Margery Ln
- 137 Margery Ln
- 16 Bubbling Brook Rd
- 87 Margery Ln
- 36 Trailside Dr
Ask me questions while you tour the home.