32 Cove St Brant Rock, MA 02020
Ocean Bluff-Brant Rock NeighborhoodEstimated Value: $476,000 - $1,160,944
About This Home
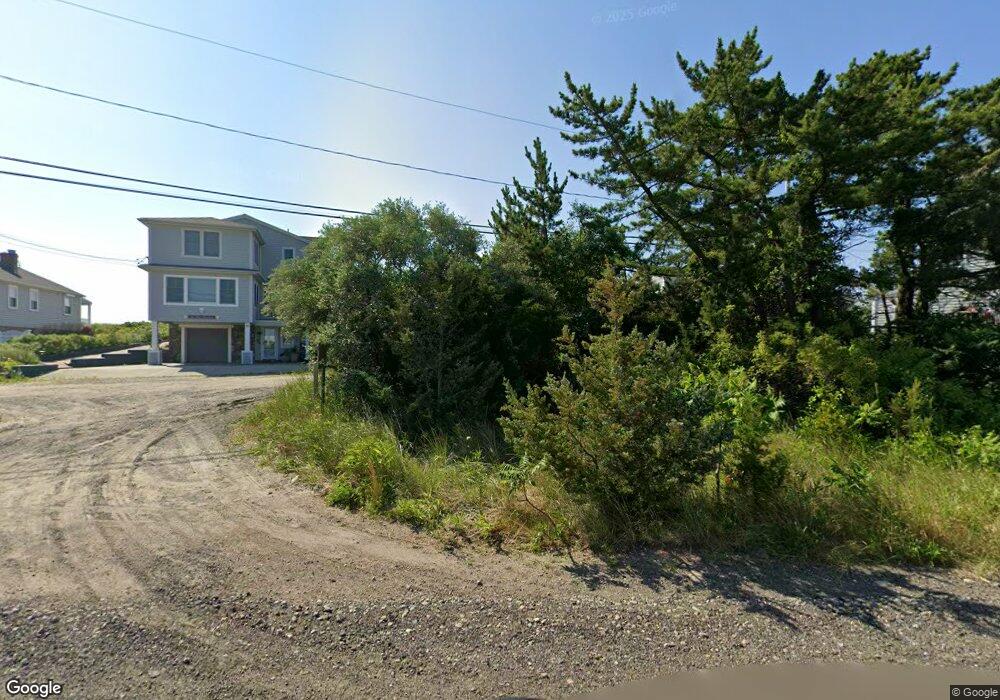
This home is located at 32 Cove St, Brant Rock, MA 02020 and is currently estimated at $911,236, approximately $1,127 per square foot. 32 Cove St is a home with nearby schools including Governor Edward Winslow School, Furnace Brook Middle School, and Marshfield High School.
Ownership History
We collect this data history from publicly available records. To have your information removed, we recommend requesting removal directly through your county’s website.
Purchase Details
Purchase Details
Purchase Details
Home Values in the Area
Average Home Value in this Area
Purchase History
We collect this data history from publicly available records. To have your information removed, we recommend requesting removal directly through your county’s website.
| Date | Buyer | Sale Price | Title Company |
|---|---|---|---|
| -- | None Available | ||
| -- | None Available | ||
| -- | None Available | ||
| -- | None Available | ||
| -- | None Available | ||
| -- | None Available | ||
| $170,000 | -- |
Mortgage History
We collect this data history from publicly available records. To have your information removed, we recommend requesting removal directly through your county’s website.
| Date | Status | Borrower | Loan Amount |
|---|---|---|---|
| Previous Owner | $60,000 |
Tax History
We collect this data history from publicly available records. To have your information removed, we recommend requesting removal directly through your county’s website.
| Year | Tax Paid | Tax Assessment Tax Assessment Total Assessment is a certain percentage of the fair market value that is determined by local assessors to be the total taxable value of land and additions on the property. | Land | Improvement |
|---|---|---|---|---|
| 2025 | $10,638 | $1,074,500 | $835,500 | $239,000 |
| 2024 | $9,838 | $946,900 | $736,000 | $210,900 |
| 2023 | $7,900 | $813,000 | $636,500 | $176,500 |
| 2022 | $7,900 | $610,000 | $467,500 | $142,500 |
| 2021 | $7,967 | $604,000 | $467,500 | $136,500 |
| 2020 | $7,574 | $568,200 | $437,600 | $130,600 |
| 2019 | $7,522 | $562,200 | $437,600 | $124,600 |
| 2018 | $7,517 | $562,200 | $437,600 | $124,600 |
| 2017 | $7,606 | $554,400 | $437,600 | $116,800 |
| 2016 | $7,628 | $549,600 | $437,600 | $112,000 |
| 2015 | $8,362 | $629,200 | $517,200 | $112,000 |
| 2014 | $8,268 | $622,100 | $517,200 | $104,900 |
Map
- 64 Central St
- 36 Ocean St
- 38 Ocean St
- 245 Careswell St
- 71 Webster Ave
- 64 Ashburton Ave
- 90 Colonial Rd
- 71 Ice House Ln
- 36 Ocean Rd N
- 39 Everett St
- 585 Careswell St
- 643 Careswell St
- 766 Ocean St
- 204 Foster Ave
- 41 Constantine Dr
- 40 Signal Hill Rd
- 47 Old Colony Ln Unit 127
- 47 Old Colony Ln Unit 240
- 145 Peterson Path
- 50 Blackmount Dr
Ask me questions while you tour the home.