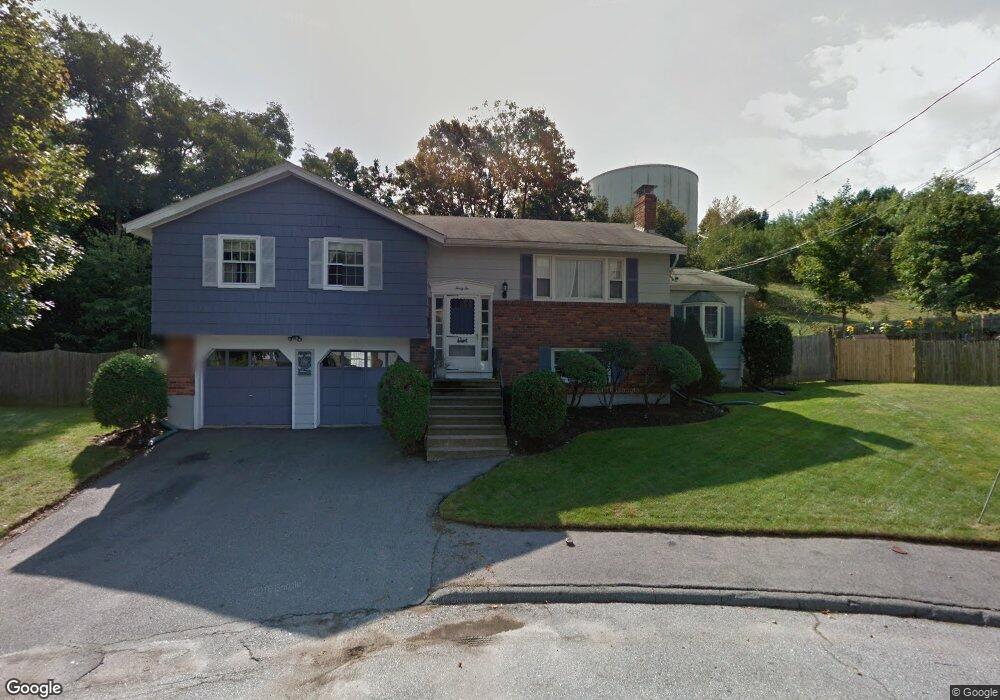
32 Crescent Dr Salem, MA 01970
Witchcraft Heights NeighborhoodEstimated Value: $727,000 - $839,000
About This Home
This home is located at 32 Crescent Dr, Salem, MA 01970 and is currently estimated at $777,365, approximately $375 per square foot. 32 Crescent Dr is a home located in Essex County with nearby schools including Witchcraft Heights Elementary School, Horace Mann Laboratory, and Saltonstall School.
Ownership History
We collect this data history from publicly available records. To have your information removed, we recommend requesting removal directly through your county’s website.
Purchase Details
Home Financials for this Owner
Home Financials are based on the most recent Mortgage that was taken out on this home.Home Values in the Area
Average Home Value in this Area
Purchase History
We collect this data history from publicly available records. To have your information removed, we recommend requesting removal directly through your county’s website.
| Date | Buyer | Sale Price | Title Company |
|---|---|---|---|
| $376,000 | -- | ||
| $376,000 | -- |
Mortgage History
We collect this data history from publicly available records. To have your information removed, we recommend requesting removal directly through your county’s website.
| Date | Status | Borrower | Loan Amount |
|---|---|---|---|
| Open | $205,000 | ||
| Closed | $205,000 | ||
| Previous Owner | $55,000 | ||
| Previous Owner | $40,000 |
Tax History
We collect this data history from publicly available records. To have your information removed, we recommend requesting removal directly through your county’s website.
| Year | Tax Paid | Tax Assessment Tax Assessment Total Assessment is a certain percentage of the fair market value that is determined by local assessors to be the total taxable value of land and additions on the property. | Land | Improvement |
|---|---|---|---|---|
| 2025 | $7,221 | $636,800 | $256,100 | $380,700 |
| 2024 | $7,207 | $620,200 | $241,700 | $378,500 |
| 2023 | $6,994 | $559,100 | $220,000 | $339,100 |
| 2022 | $6,508 | $491,200 | $202,000 | $289,200 |
| 2021 | $6,326 | $458,400 | $187,600 | $270,800 |
| 2020 | $6,429 | $444,900 | $184,000 | $260,900 |
| 2019 | $6,374 | $422,100 | $173,100 | $249,000 |
| 2018 | $6,109 | $397,200 | $161,600 | $235,600 |
| 2017 | $5,870 | $370,100 | $151,500 | $218,600 |
| 2016 | $5,799 | $370,100 | $151,500 | $218,600 |
| 2015 | $5,504 | $335,400 | $133,500 | $201,900 |
Map
- 11 1/2 Albion St
- 3 Witch Way
- 23 Putnam St
- 41 Ord St
- 65 Ord St
- 78 Boston St Unit 78
- 25 Bow St
- 134 Boston St Unit 1B
- 145 Boston St
- 18 Shillaber St
- 20 Beacon St
- 434 Essex St Unit 2R
- 99 Mason St Unit 2
- 72 Aborn St Unit 1
- 45.5 Aborn St Unit 2
- 26 Beckett St
- 401 Essex St
- 394 Essex St Unit 3
- 395 Essex St
- 33 Chestnut St
Ask me questions while you tour the home.