32 Crescent St Swampscott, MA 01907
Estimated Value: $628,743 - $695,000
About This Home
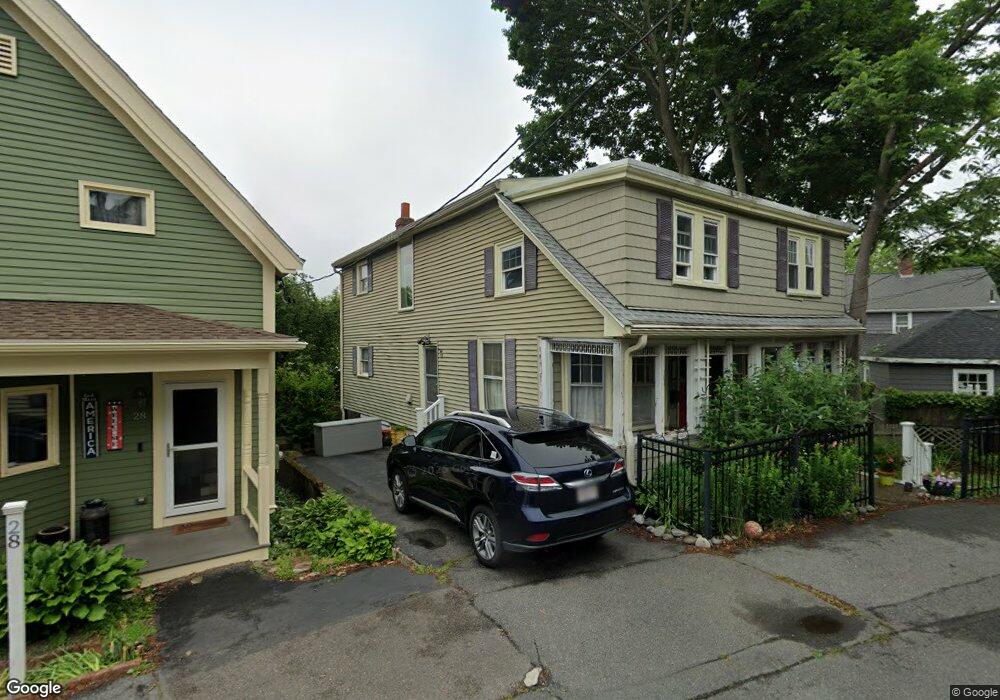
This home is located at 32 Crescent St, Swampscott, MA 01907 and is currently estimated at $676,436, approximately $413 per square foot. 32 Crescent St is a home located in Essex County with nearby schools including Swampscott Middle School and Swampscott High School.
Ownership History
We collect this data history from publicly available records. To have your information removed, we recommend requesting removal directly through your county’s website.
Purchase Details
Purchase Details
Home Values in the Area
Average Home Value in this Area
Purchase History
We collect this data history from publicly available records. To have your information removed, we recommend requesting removal directly through your county’s website.
| Date | Buyer | Sale Price | Title Company |
|---|---|---|---|
| $162,000 | -- | ||
| $162,000 | -- | ||
| $121,000 | -- | ||
| $121,000 | -- |
Mortgage History
We collect this data history from publicly available records. To have your information removed, we recommend requesting removal directly through your county’s website.
| Date | Status | Borrower | Loan Amount |
|---|---|---|---|
| Open | $195,000 | ||
| Closed | $23,000 |
Tax History
We collect this data history from publicly available records. To have your information removed, we recommend requesting removal directly through your county’s website.
| Year | Tax Paid | Tax Assessment Tax Assessment Total Assessment is a certain percentage of the fair market value that is determined by local assessors to be the total taxable value of land and additions on the property. | Land | Improvement |
|---|---|---|---|---|
| 2025 | $6,641 | $579,000 | $215,800 | $363,200 |
| 2024 | $6,477 | $563,700 | $205,500 | $358,200 |
| 2023 | $6,102 | $519,800 | $190,300 | $329,500 |
| 2022 | $5,750 | $448,200 | $167,500 | $280,700 |
| 2021 | $5,578 | $404,200 | $129,400 | $274,800 |
| 2020 | $5,616 | $392,700 | $121,800 | $270,900 |
| 2019 | $5,738 | $377,500 | $106,600 | $270,900 |
| 2018 | $5,726 | $357,900 | $106,600 | $251,300 |
| 2017 | $5,635 | $322,900 | $91,300 | $231,600 |
| 2016 | $5,267 | $303,900 | $72,300 | $231,600 |
| 2015 | $5,212 | $303,900 | $72,300 | $231,600 |
| 2014 | $4,735 | $253,200 | $51,800 | $201,400 |
Map
- 13 Roy St Unit 3
- 70 Mudge St Unit 3
- 70 Mudge St Unit 19
- 70 Mudge St Unit 17
- 13 Essex St Unit 2
- 8 Essex St
- 67 Beach Ave
- 40 Archer St
- 22 Beach Ave
- 10 Williams Ave
- 246 Burrill St
- 88 Empire St
- 161 Marianna St
- 33A Jackson St Unit 103
- 191 Eastern Ave
- 84 Windsor Ave
- 141 Essex St
- 75 Alden St
- 46 Brookline St
- 187 Burrill St Unit 2
- 13 Roy St
- 13 Roy St Unit 1
- 13 Roy St Unit 2
- 9 Roy St
- 15 Roy St
- 34 Crescent St
- 55 Hillside Ave
- 55 Hillside Ave Unit SF
- 28 Crescent St
- 10 Roy St
- 19 Roy St
- 51 Hillside Ave
- 21 Roy St
- 33 Crescent St Unit 35
- 33-35 Crescent St
- 33 Crescent St Unit 2
- 35 Crescent St Unit 1
- 33-35 Crescent St Unit 1
- 33 Crescent St Unit 3
- 35 Crescent St Unit A
Ask me questions while you tour the home.