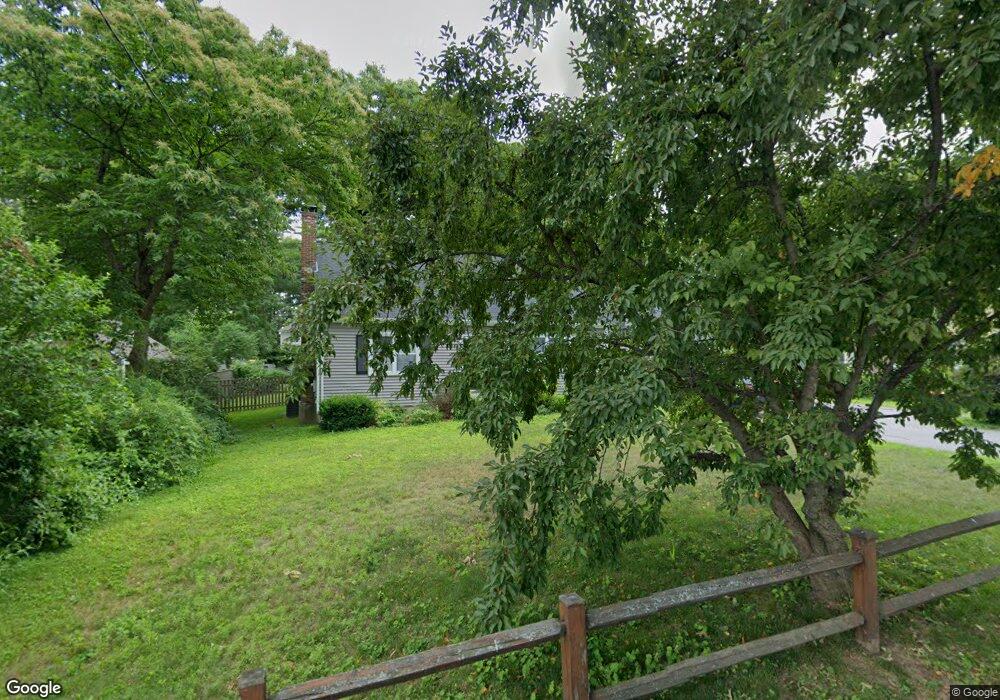
32 Evergreen Rd Natick, MA 01760
Estimated Value: $994,245 - $1,076,000
3
Beds
2
Baths
1,890
Sq Ft
$548/Sq Ft
Est. Value
About This Home
This home is located at 32 Evergreen Rd, Natick, MA 01760 and is currently estimated at $1,034,811, approximately $547 per square foot. 32 Evergreen Rd is a home located in Middlesex County with nearby schools including Natick High School, Bennett-Hemenway (Ben-Hem) Elementary School, and Wilson Middle School.
Ownership History
Date
Name
Owned For
Owner Type
Purchase Details
Closed on
Jun 18, 2008
Sold by
Newman Eleanor E Est
Bought by
Simon Elizabeth M and Simon Jonathan
Current Estimated Value
Home Financials for this Owner
Home Financials are based on the most recent Mortgage that was taken out on this home.
Original Mortgage
$399,350
Outstanding Balance
$256,916
Interest Rate
6.1%
Mortgage Type
Purchase Money Mortgage
Estimated Equity
$777,895
Create a Home Valuation Report for This Property
The Home Valuation Report is an in-depth analysis detailing your home's value as well as a comparison with similar homes in the area
Home Values in the Area
Average Home Value in this Area
Purchase History
We collect this data history from publicly available records. To have your information removed, we recommend requesting removal directly through your county’s website.
| Date | Buyer | Sale Price | Title Company |
|---|---|---|---|
| Simon Elizabeth M | $455,000 | -- | |
| Simon Elizabeth M | $455,000 | -- |
Source: Public Records
Mortgage History
We collect this data history from publicly available records. To have your information removed, we recommend requesting removal directly through your county’s website.
| Date | Status | Borrower | Loan Amount |
|---|---|---|---|
| Open | Simon Elizabeth M | $399,350 | |
| Closed | Simon Elizabeth M | $399,350 |
Source: Public Records
Tax History
| Year | Tax Paid | Tax Assessment Tax Assessment Total Assessment is a certain percentage of the fair market value that is determined by local assessors to be the total taxable value of land and additions on the property. | Land | Improvement |
|---|---|---|---|---|
| 2025 | $10,388 | $868,600 | $438,700 | $429,900 |
| 2024 | $10,057 | $820,300 | $412,800 | $407,500 |
| 2023 | $9,692 | $766,800 | $396,100 | $370,700 |
| 2022 | $9,469 | $709,800 | $359,000 | $350,800 |
| 2021 | $0 | $667,400 | $338,500 | $328,900 |
| 2020 | $8,874 | $652,000 | $323,100 | $328,900 |
| 2019 | $5,418 | $652,000 | $323,100 | $328,900 |
| 2018 | $7,243 | $555,000 | $307,700 | $247,300 |
| 2017 | $6,845 | $507,400 | $264,600 | $242,800 |
| 2016 | $6,571 | $484,200 | $243,600 | $240,600 |
| 2015 | $6,414 | $464,100 | $243,600 | $220,500 |
Source: Public Records
Map
Nearby Homes
- 9 Lotus Path
- 6 Ash St
- 22 Magnolia Rd
- 9 Cypress Rd
- 254 N Main St
- 20 Pine St
- 136 Commonwealth Rd
- 288 Bacon St
- 17 Bradford Rd
- 8 N Pleasant St Unit 8
- 5 Bradford Rd
- 265 Bacon St Unit B
- 265 Bacon St
- 31 Arcadia Rd
- 20 Wheeler Ln
- 40 Nouvelle Way Unit 644
- 40 Nouvelle Way Unit 241
- 10 Liberty St
- 48 Bradford Rd
- 9 Overhill Rd
- 34 Evergreen Rd
- 26 Evergreen Rd
- 31 Evergreen Rd
- 36 Evergreen Rd
- 29 Evergreen Rd
- 19 Crest Rd
- 33 Evergreen Rd
- 27 Evergreen Rd
- 17 Crest Rd
- 35 Evergreen Rd
- 6 Magnolia Rd
- 2 Magnolia Rd
- 8 Magnolia Rd
- 22 Evergreen Rd
- 40 Evergreen Rd
- 24 Evergreen Rd
- 11 Crest Rd
- 41 Evergreen Rd
- 10 Magnolia Rd
- 42 Evergreen Rd
Your Personal Tour Guide
Ask me questions while you tour the home.